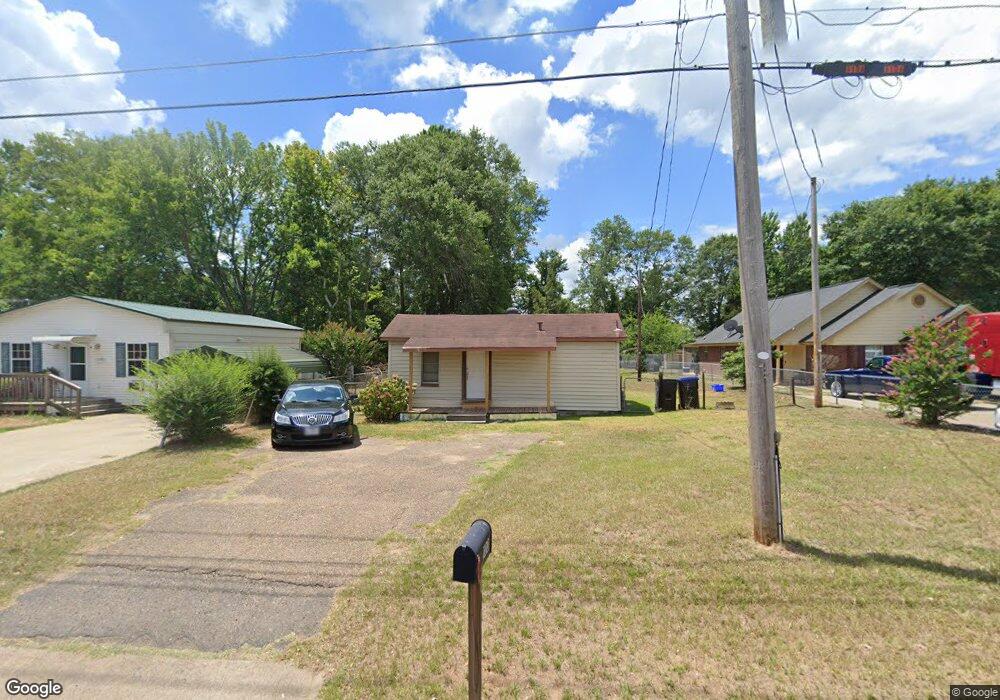
1100 Whitney St Longview, TX 75602
Estimated Value: $56,898 - $118,000
--
Bed
1
Bath
654
Sq Ft
$142/Sq Ft
Est. Value
About This Home
This home is located at 1100 Whitney St, Longview, TX 75602 and is currently estimated at $92,975, approximately $142 per square foot. 1100 Whitney St is a home located in Gregg County with nearby schools including Bailey Elementary, Hudson PEP Elementary School, and Ware Elementary School.
Create a Home Valuation Report for This Property
The Home Valuation Report is an in-depth analysis detailing your home's value as well as a comparison with similar homes in the area
Home Values in the Area
Average Home Value in this Area
Tax History Compared to Growth
Tax History
| Year | Tax Paid | Tax Assessment Tax Assessment Total Assessment is a certain percentage of the fair market value that is determined by local assessors to be the total taxable value of land and additions on the property. | Land | Improvement |
|---|---|---|---|---|
| 2025 | $809 | $51,390 | $4,200 | $47,190 |
| 2024 | $809 | $40,440 | $4,200 | $36,240 |
| 2023 | $686 | $34,630 | $4,200 | $30,430 |
| 2022 | $579 | $26,470 | $3,000 | $23,470 |
| 2021 | $508 | $22,490 | $2,880 | $19,610 |
| 2020 | $443 | $19,570 | $2,880 | $16,690 |
| 2019 | $453 | $19,810 | $2,940 | $16,870 |
| 2018 | $436 | $19,130 | $2,910 | $16,220 |
| 2017 | $432 | $18,900 | $2,910 | $15,990 |
| 2016 | $421 | $18,410 | $2,910 | $15,500 |
| 2015 | $417 | $18,260 | $3,200 | $15,060 |
| 2014 | -- | $17,770 | $3,140 | $14,630 |
Source: Public Records
Map
Nearby Homes
- 1208 Raney St
- 2343 Bates St
- 2325 Bates St
- 407 S Eastman Rd
- 1005 Agness Dr
- 1801-1803-1809 S Eastman Rd
- TBD Osborne St
- 1208 Sapphire St
- 904 Butler Dr
- 1411 Sapphire St
- 1109 Millie St
- 1105 Millie St
- 1504 S 12th St
- 810 Butler Dr
- 1000 Millie St
- 1410 S 12th St
- 405 Millie St
- 814 E Travis Ave
- 1111 Millie St
- 1009 Millie St
- 1018 Whitney St
- 1102 Whitney St
- 1104 Whitney St
- 1014 Whitney St
- 1106 Whitney St
- 1105 Arvern St
- 1101 Arvern St
- 2102 Armond Dr
- 2107 Victory St
- 2106 Armond Dr
- 2109 Victory St
- 2111 Victory St
- 2100 S M L K Jr Blvd
- 2200 Armond Dr
- 1104 Arvern St
- 2113 Victory St
- 1100 Arvern St
- 2115 Victory St
- 1200 Whitney St
- 2202 Armond Dr