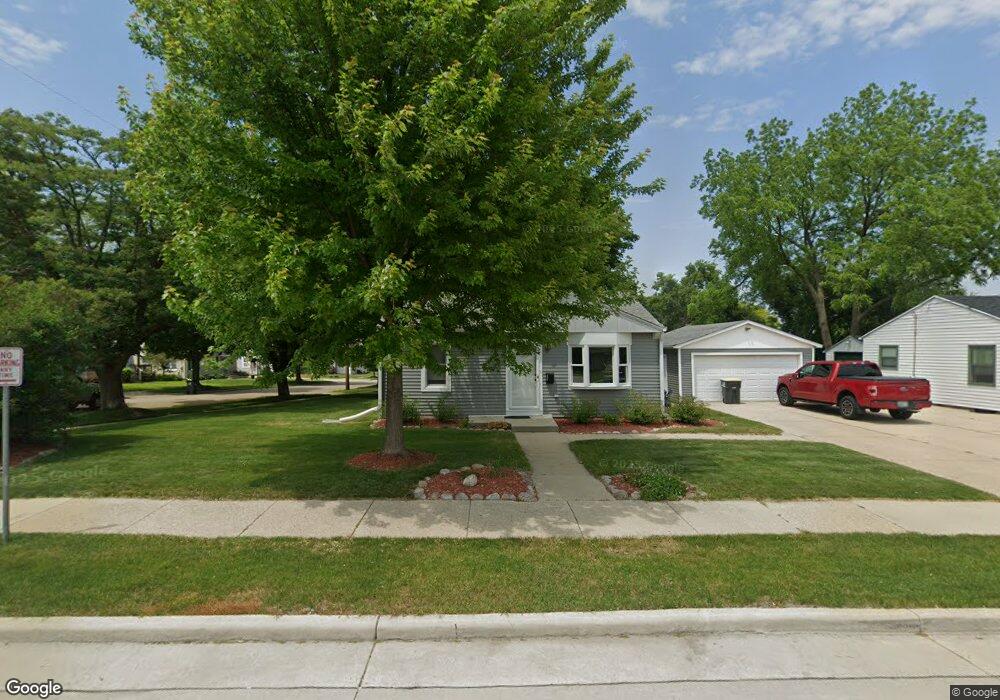
1102 Arcadian Ave Waukesha, WI 53186
Estimated Value: $224,599 - $262,000
2
Beds
1
Bath
725
Sq Ft
$336/Sq Ft
Est. Value
About This Home
This home is located at 1102 Arcadian Ave, Waukesha, WI 53186 and is currently estimated at $243,650, approximately $336 per square foot. 1102 Arcadian Ave is a home located in Waukesha County with nearby schools including Hadfield Elementary School, Horning Middle School, and South High School.
Ownership History
Date
Name
Owned For
Owner Type
Purchase Details
Closed on
Feb 7, 2025
Sold by
Ballendux Frank J
Bought by
Fank J Ballendux Trust and Ballendux
Current Estimated Value
Purchase Details
Closed on
Feb 28, 2003
Sold by
Seftar Stephen M and Seftar Christy L
Bought by
Ballendux Frank
Home Financials for this Owner
Home Financials are based on the most recent Mortgage that was taken out on this home.
Original Mortgage
$120,000
Interest Rate
6%
Mortgage Type
Balloon
Purchase Details
Closed on
Feb 23, 2001
Sold by
Tritz Ronald J and Tritz Kathleen G
Bought by
Sefter Stephen M and Lyons Christy L
Home Financials for this Owner
Home Financials are based on the most recent Mortgage that was taken out on this home.
Original Mortgage
$106,100
Interest Rate
8%
Purchase Details
Closed on
Jul 6, 2000
Sold by
Jacobson Duane A and Jacobson Lois
Bought by
Singletary Kent A and Singletary Merilee
Create a Home Valuation Report for This Property
The Home Valuation Report is an in-depth analysis detailing your home's value as well as a comparison with similar homes in the area
Home Values in the Area
Average Home Value in this Area
Purchase History
| Date | Buyer | Sale Price | Title Company |
|---|---|---|---|
| Fank J Ballendux Trust | -- | None Listed On Document | |
| Ballendux Frank | $120,000 | -- | |
| Sefter Stephen M | $105,000 | -- | |
| Singletary Kent A | $5,000 | -- |
Source: Public Records
Mortgage History
| Date | Status | Borrower | Loan Amount |
|---|---|---|---|
| Previous Owner | Ballendux Frank | $120,000 | |
| Previous Owner | Sefter Stephen M | $106,100 |
Source: Public Records
Tax History Compared to Growth
Tax History
| Year | Tax Paid | Tax Assessment Tax Assessment Total Assessment is a certain percentage of the fair market value that is determined by local assessors to be the total taxable value of land and additions on the property. | Land | Improvement |
|---|---|---|---|---|
| 2024 | $2,685 | $187,000 | $48,200 | $138,800 |
| 2023 | $2,592 | $187,000 | $48,200 | $138,800 |
| 2022 | $2,331 | $127,000 | $51,400 | $75,600 |
| 2021 | $2,371 | $127,000 | $51,400 | $75,600 |
| 2020 | $2,314 | $127,000 | $51,400 | $75,600 |
| 2019 | $2,229 | $127,000 | $51,400 | $75,600 |
| 2018 | $2,093 | $116,500 | $46,500 | $70,000 |
| 2017 | $2,103 | $116,500 | $46,500 | $70,000 |
| 2016 | $2,088 | $108,900 | $44,000 | $64,900 |
| 2015 | $2,081 | $108,900 | $44,000 | $64,900 |
| 2014 | $2,149 | $107,800 | $44,000 | $63,800 |
| 2013 | $2,149 | $107,800 | $44,000 | $63,800 |
Source: Public Records
Map
Nearby Homes
- 1021 Arcadian Ave
- 953 Genesee St
- 1103 Arcadian Ave
- 930 Harding Ave
- 1219 National Ave
- 1021 Aurora St
- 512 E Main St
- 1349 Rose Ct Unit 62
- 918 Niagara St
- 1139 White Rock Ave
- 1333 Niagara St
- 1462 Cleveland Ave
- 1471 Cleveland Ave
- 1308 Danny St
- 937 E Moreland Blvd
- 100 E Main St Unit 403
- 100 E Main St Unit 307
- 1343 Hillside Dr
- S21W23079 Hillside Dr
- 1609 Murray Ave
- 910 Genesee St
- 914 Genesee St
- 913 Genesee St
- 1108 Arcadian Ave
- 1107 Arcadian Ave Unit 1109
- 1114 Arcadian Ave
- 917 Genesee St
- 1022 Arcadian Ave
- 860 Genesee St
- 1118 Arcadian Ave
- 918 Genesee St
- 1120 Arcadian Ave
- 927 Genesee St
- 923 Genesee St
- 870 Perkins Ave
- 926 Genesee St
- 922 Genesee St
- 1010 Arcadian Ave
- 1013 Arcadian Ave
- 920 Perkins Ave