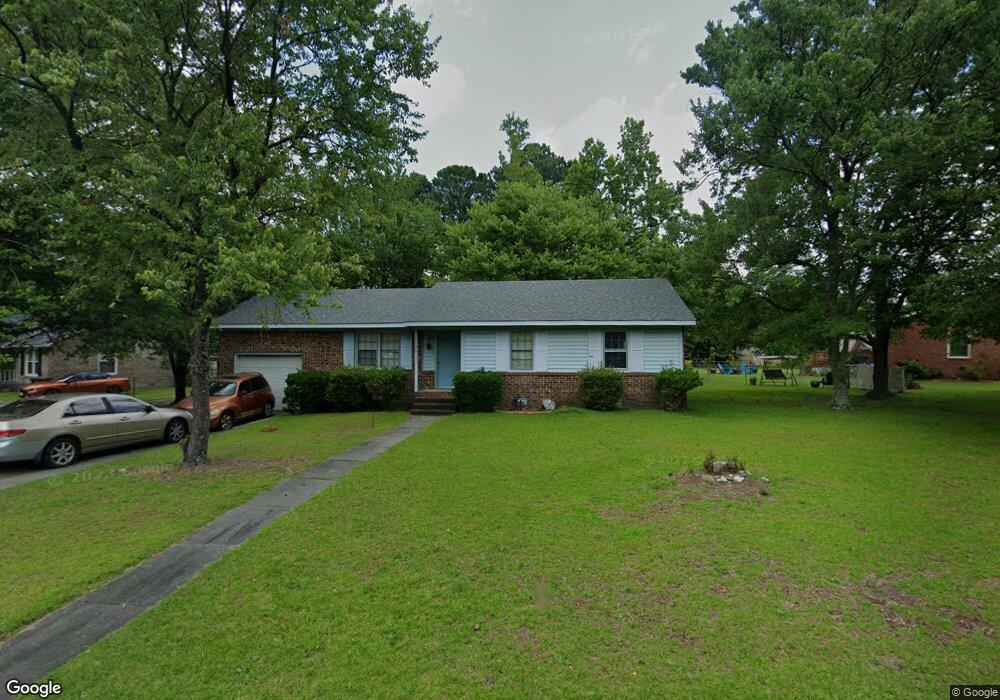
1102 Cortland Rd Greenville, NC 27834
Estimated Value: $148,000 - $182,000
3
Beds
2
Baths
1,059
Sq Ft
$156/Sq Ft
Est. Value
About This Home
This home is located at 1102 Cortland Rd, Greenville, NC 27834 and is currently estimated at $165,274, approximately $156 per square foot. 1102 Cortland Rd is a home located in Pitt County with nearby schools including South Greenville Elementary School, E.B. Aycock Middle School, and Junius H. Rose High School.
Ownership History
Date
Name
Owned For
Owner Type
Purchase Details
Closed on
Sep 18, 2006
Sold by
Edwards Jeffrey G and Edwards Celeste
Bought by
Teeele Lyman L and Teeele Sylvia S
Current Estimated Value
Home Financials for this Owner
Home Financials are based on the most recent Mortgage that was taken out on this home.
Original Mortgage
$84,500
Outstanding Balance
$50,218
Interest Rate
6.48%
Mortgage Type
New Conventional
Estimated Equity
$115,056
Purchase Details
Closed on
May 22, 2006
Sold by
Bank One Na
Bought by
Edwards Jeffrey G
Home Financials for this Owner
Home Financials are based on the most recent Mortgage that was taken out on this home.
Original Mortgage
$50,400
Interest Rate
6.68%
Mortgage Type
New Conventional
Purchase Details
Closed on
Feb 17, 2006
Sold by
Davis Mary Ann and Blount Cora
Bought by
Bank One Na
Create a Home Valuation Report for This Property
The Home Valuation Report is an in-depth analysis detailing your home's value as well as a comparison with similar homes in the area
Home Values in the Area
Average Home Value in this Area
Purchase History
| Date | Buyer | Sale Price | Title Company |
|---|---|---|---|
| Teeele Lyman L | $84,500 | None Available | |
| Edwards Jeffrey G | $63,000 | None Available | |
| Bank One Na | $60,000 | None Available |
Source: Public Records
Mortgage History
| Date | Status | Borrower | Loan Amount |
|---|---|---|---|
| Open | Teeele Lyman L | $84,500 | |
| Previous Owner | Edwards Jeffrey G | $50,400 |
Source: Public Records
Tax History Compared to Growth
Tax History
| Year | Tax Paid | Tax Assessment Tax Assessment Total Assessment is a certain percentage of the fair market value that is determined by local assessors to be the total taxable value of land and additions on the property. | Land | Improvement |
|---|---|---|---|---|
| 2025 | $1,263 | $161,402 | $20,000 | $141,402 |
| 2024 | $1,251 | $161,402 | $20,000 | $141,402 |
| 2023 | $448 | $73,273 | $19,500 | $53,773 |
| 2022 | $452 | $73,273 | $19,500 | $53,773 |
| 2021 | $448 | $73,273 | $19,500 | $53,773 |
| 2020 | $451 | $73,273 | $19,500 | $53,773 |
| 2019 | $514 | $80,196 | $19,500 | $60,696 |
| 2018 | $499 | $80,196 | $19,500 | $60,696 |
| 2017 | $499 | $80,196 | $19,500 | $60,696 |
| 2016 | $454 | $35,196 | $0 | $0 |
| 2015 | $454 | $31,906 | $0 | $0 |
| 2014 | $454 | $31,906 | $0 | $0 |
Source: Public Records
Map
Nearby Homes
- 102 Farmhouse Place
- 103 Cambridge Rd
- 112 Ridge Place
- 716 Hooker Rd
- 112 Concord Dr Unit C
- 214 Arlington Cir
- 108 Dogwood Dr
- 0 Evans St
- 8 N Carolina 43
- 115 Heritage St
- 2506 Sunset Ave
- 402 Kirkland Dr
- 401 Martinsborough Rd
- 303 Deck St
- 3256 Landmark St Unit A 2
- 226 Country Club Dr
- 1906 S Greene St
- 204 Williamsburg Dr
- 306 Granville Dr
- 209 Harmony St
- 1104 Cortland Rd
- 1100 Cortland Rd
- 1106 Cortland Rd
- 213 Freestone Rd
- 1006 Cortland Rd
- 215 Freestone Rd
- 1105 Cortland Rd
- 1101 Cortland Rd
- 1108 Cortland Rd
- 1107 Cortland Rd
- 1103 Cortland Rd
- 211 Freestone Rd
- 1109 Cortland Rd
- 1004 Cortland Rd
- 103 Tamarind Rd
- 218 Freestone Rd
- 1009 Cortland Rd
- 209 Freestone Rd
- 1111 Cortland Rd
- 106 Greenbriar Dr