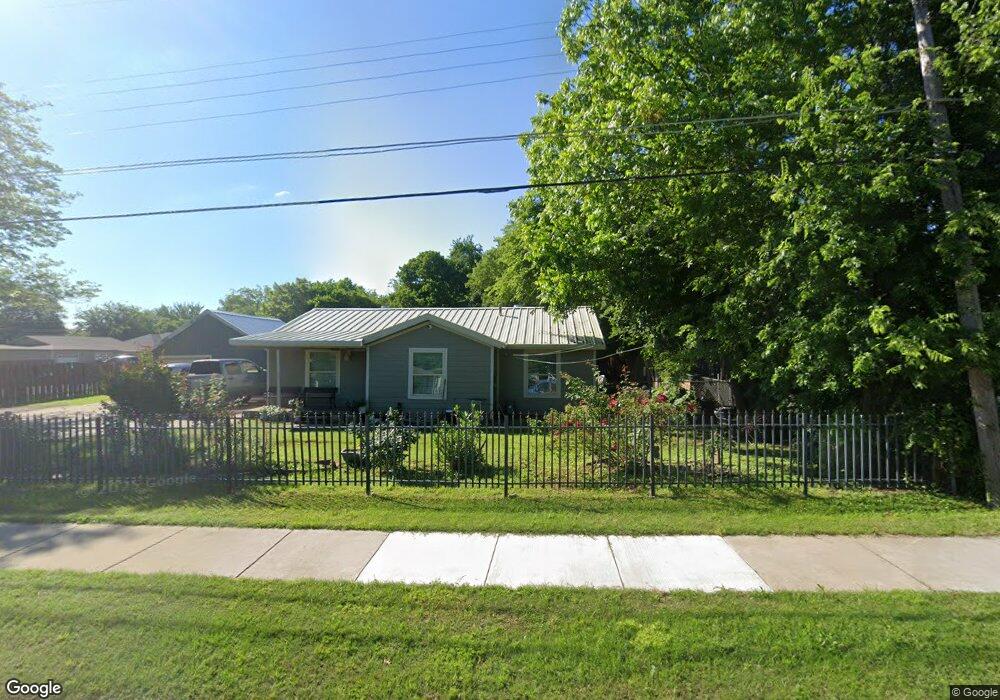
1103 Poindexter Ave Cleburne, TX 76033
Estimated Value: $197,000 - $208,000
3
Beds
1
Bath
1,316
Sq Ft
$154/Sq Ft
Est. Value
About This Home
This home is located at 1103 Poindexter Ave, Cleburne, TX 76033 and is currently estimated at $202,984, approximately $154 per square foot. 1103 Poindexter Ave is a home located in Johnson County with nearby schools including Cooke Elementary School, A.D. Wheat Middle School, and Cleburne High School.
Ownership History
Date
Name
Owned For
Owner Type
Purchase Details
Closed on
Feb 25, 2011
Sold by
Reid Kevin and Reid Jennifer
Bought by
Ramirez Joel and Ramirez Leticia
Current Estimated Value
Home Financials for this Owner
Home Financials are based on the most recent Mortgage that was taken out on this home.
Original Mortgage
$20,750
Interest Rate
4.73%
Mortgage Type
Purchase Money Mortgage
Purchase Details
Closed on
Sep 27, 2006
Sold by
Ragon Steve and Ragon Lana
Bought by
Hill Earl O
Home Financials for this Owner
Home Financials are based on the most recent Mortgage that was taken out on this home.
Original Mortgage
$68,800
Interest Rate
6.51%
Mortgage Type
Purchase Money Mortgage
Purchase Details
Closed on
Mar 15, 2006
Sold by
Property Asset Management Inc
Bought by
Ragon Steve and Ragon Lana
Home Financials for this Owner
Home Financials are based on the most recent Mortgage that was taken out on this home.
Original Mortgage
$69,900
Interest Rate
6.21%
Mortgage Type
Purchase Money Mortgage
Purchase Details
Closed on
Jan 3, 2006
Sold by
Rodriguez Elizabeth and Rodriguez Juan
Bought by
Property Asset Management Inc
Create a Home Valuation Report for This Property
The Home Valuation Report is an in-depth analysis detailing your home's value as well as a comparison with similar homes in the area
Home Values in the Area
Average Home Value in this Area
Purchase History
| Date | Buyer | Sale Price | Title Company |
|---|---|---|---|
| Ramirez Joel | -- | Stnt | |
| Hill Earl O | -- | Stnt | |
| Ragon Steve | -- | Fatco | |
| Property Asset Management Inc | $42,375 | None Available |
Source: Public Records
Mortgage History
| Date | Status | Borrower | Loan Amount |
|---|---|---|---|
| Closed | Ramirez Joel | $20,750 | |
| Previous Owner | Hill Earl O | $68,800 | |
| Previous Owner | Ragon Steve | $69,900 |
Source: Public Records
Tax History Compared to Growth
Tax History
| Year | Tax Paid | Tax Assessment Tax Assessment Total Assessment is a certain percentage of the fair market value that is determined by local assessors to be the total taxable value of land and additions on the property. | Land | Improvement |
|---|---|---|---|---|
| 2025 | $1,208 | $170,259 | $30,500 | $139,759 |
| 2024 | $2,511 | $112,624 | $0 | $0 |
| 2023 | $984 | $170,259 | $30,500 | $139,759 |
| 2022 | $2,329 | $138,369 | $30,500 | $107,869 |
| 2021 | $2,208 | $138,369 | $30,500 | $107,869 |
| 2020 | $2,132 | $117,378 | $28,000 | $89,378 |
| 2019 | $2,066 | $117,378 | $28,000 | $89,378 |
| 2018 | $1,879 | $100,124 | $28,000 | $72,124 |
| 2017 | $1,701 | $72,040 | $28,000 | $44,040 |
| 2016 | $1,547 | $52,540 | $8,500 | $44,040 |
| 2015 | $1,127 | $52,540 | $8,500 | $44,040 |
| 2014 | $1,127 | $52,540 | $8,500 | $44,040 |
Source: Public Records
Map
Nearby Homes
- 1307 Joslin St
- 1123 Bales St
- 916 Poindexter Ave
- 902 Turner St
- 800 Madison St
- 807 Poindexter Ave
- 805 Marengo St
- 618 Woodard Ave
- 808 Marengo St
- 107 Woodard Ave
- 1315 Grand Ave
- 905 Euclid St
- 1006 Princeton Place
- 810 Euclid St
- 1300 Holly St
- 701 Poindexter Ave
- 502 Bales St
- 704 Graham St
- 106 Glen Rose Ave
- 1016 Sheridan Ln
- 1105 Poindexter Ave
- 1307 N Douglas Ave
- 1011 Poindexter Ave
- 1107 Poindexter Ave
- 1104 Poindexter Ave
- 1113 Poindexter Ave
- 1305 N Douglas Ave
- 1102 Poindexter Ave
- 1106 Poindexter Ave
- 1009 Poindexter Ave
- 1310 N Douglas Ave
- 1108 Poindexter Ave
- 1030 Poindexter Ave
- 1204 W Lone Star Ave
- 1115 Poindexter Ave
- 1007 Poindexter Ave
- 1110 Poindexter Ave
- 1208 W Lone Star Ave
- 1028 Poindexter Ave
- 1308 Joslin St