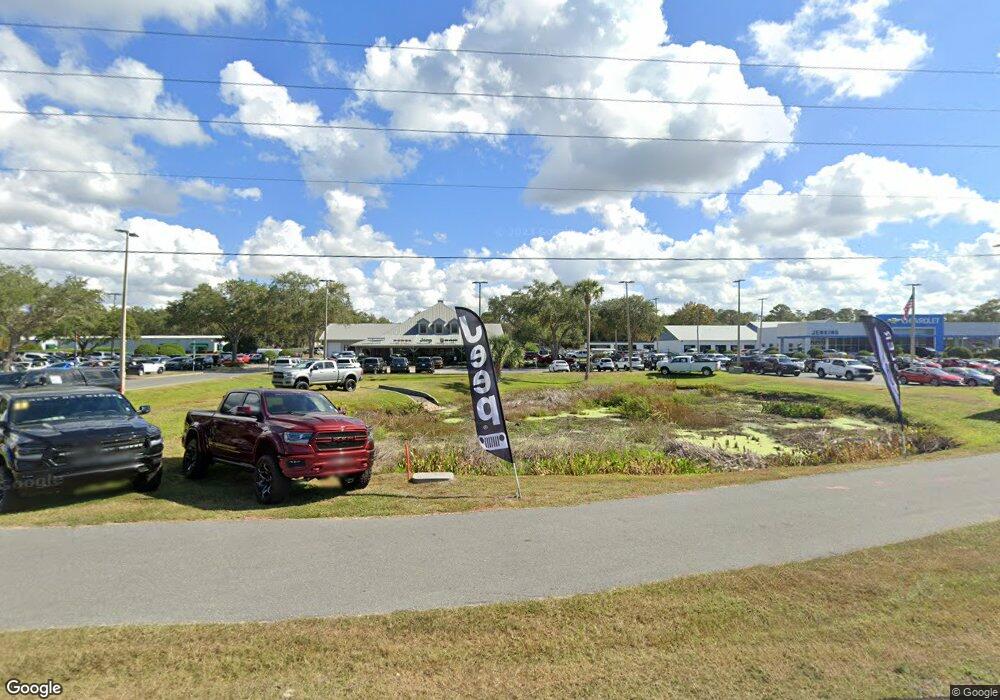
1103 S Suncoast Blvd Crystal River, FL 34429
Estimated Value: $36,000
--
Bed
68
Baths
10,793
Sq Ft
$3/Sq Ft
Est. Value
About This Home
This home is located at 1103 S Suncoast Blvd, Crystal River, FL 34429 and is currently priced at $36,000, approximately $3 per square foot. 1103 S Suncoast Blvd is a home located in Citrus County with nearby schools including Crystal River High School, Rock Crusher Elementary School, and Crystal River Middle School.
Ownership History
Date
Name
Owned For
Owner Type
Purchase Details
Closed on
May 19, 2011
Sold by
Crystal Place Llc
Bought by
Mld 3 Llc
Current Estimated Value
Purchase Details
Closed on
Aug 1, 2010
Bought by
Mld 3 Llc
Purchase Details
Closed on
Jun 28, 2006
Sold by
Berpie Inc
Bought by
Crystal Place Llc
Home Financials for this Owner
Home Financials are based on the most recent Mortgage that was taken out on this home.
Original Mortgage
$381,551
Interest Rate
6.6%
Mortgage Type
Commercial
Purchase Details
Closed on
Sep 12, 2005
Sold by
Waddington Susan
Bought by
Berpie Inc
Home Financials for this Owner
Home Financials are based on the most recent Mortgage that was taken out on this home.
Original Mortgage
$368,900
Interest Rate
5.86%
Mortgage Type
Commercial
Purchase Details
Closed on
Jul 1, 2003
Bought by
Mld 3 Llc
Purchase Details
Closed on
May 1, 2003
Bought by
Mld 3 Llc
Create a Home Valuation Report for This Property
The Home Valuation Report is an in-depth analysis detailing your home's value as well as a comparison with similar homes in the area
Home Values in the Area
Average Home Value in this Area
Purchase History
| Date | Buyer | Sale Price | Title Company |
|---|---|---|---|
| Mld 3 Llc | $4,000 | None Available | |
| Mld 3 Llc | $100 | -- | |
| Crystal Place Llc | $380,000 | The Title Depot Inc | |
| Berpie Inc | $500,000 | The Title Depot Inc | |
| Mld 3 Llc | $100 | -- | |
| Mld 3 Llc | $100 | -- |
Source: Public Records
Mortgage History
| Date | Status | Borrower | Loan Amount |
|---|---|---|---|
| Previous Owner | Crystal Place Llc | $381,551 | |
| Previous Owner | Berpie Inc | $368,900 |
Source: Public Records
Tax History Compared to Growth
Tax History
| Year | Tax Paid | Tax Assessment Tax Assessment Total Assessment is a certain percentage of the fair market value that is determined by local assessors to be the total taxable value of land and additions on the property. | Land | Improvement |
|---|---|---|---|---|
| 2024 | $136,302 | $6,745,720 | $347,940 | $6,397,780 |
| 2023 | $136,302 | $6,494,800 | $339,760 | $6,155,040 |
| 2022 | $123,994 | $6,067,000 | $339,760 | $5,727,240 |
| 2021 | $124,891 | $6,162,760 | $334,780 | $5,827,980 |
| 2020 | $121,209 | $7,169,070 | $334,780 | $6,834,290 |
| 2019 | $115,493 | $7,163,480 | $334,780 | $6,828,700 |
| 2018 | $106,809 | $6,686,100 | $334,780 | $6,351,320 |
| 2017 | $95,078 | $5,474,470 | $334,780 | $5,139,690 |
| 2016 | $85,761 | $4,667,106 | $352,190 | $4,314,916 |
| 2015 | $76,745 | $3,842,170 | $352,190 | $3,489,980 |
| 2014 | $78,606 | $3,846,362 | $323,223 | $3,523,139 |
Source: Public Records
Map
Nearby Homes
- 8107 W Mayfair Dr
- 3409 S Suncoast Blvd
- 8944 W White Dogwood Dr
- 8952 W White Dogwood Dr
- 2704 S Pebblebrook Dr Unit 201
- 3404 S Michigan Blvd
- 2520 S Suncoast Blvd
- 8374 W Mayfair Dr
- 3411 S Michigan Blvd
- 2664 S Pebblebrook Dr
- 8355 W Charmaine Dr
- 2450 S Suncoast Blvd
- 2621 S Pebblebrook Dr
- 8473 W Elossa Ct
- 2598 S Sable Point
- 2695 S Pebblebrook Dr Unit 202
- 2608 S Pebblebrook Dr
- 8696 W Faust Ln
- 8275 W Windhaven Place
- 8118 W Windhaven Place
- 208 & 228 S Suncoast Blvd
- 3101 S Suncoast Blvd
- 8793 W Tradeways Ct
- 8710 W Tradeways Ct
- 3171 S Michigan Blvd
- 3190 S Michigan Blvd
- 8650 W Jump Ct
- 8829 W Tradeways Ct
- 3279 S Suncoast Blvd
- 3241 S Canadian Way
- 3224 S Michigan Blvd
- 3209 S Michigan Blvd
- 3209 S Michigan Blvd
- 3314 S Suncoast Blvd
- 3289 S Suncoast Blvd
- 8830 W Tradeways Ct Unit 6
- 3291 S Suncoast Blvd
- 8465 W Ivy Place
- 3257 S Canadian Way
- 3297 S Suncoast Blvd