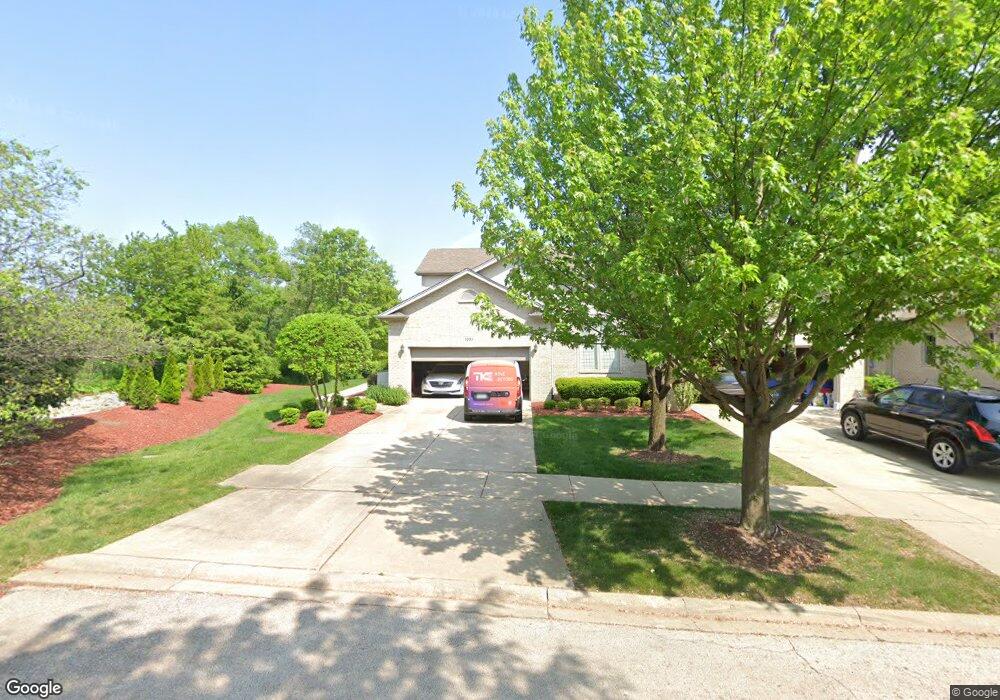
11033 Karen Dr Orland Park, IL 60467
Centennial NeighborhoodEstimated Value: $502,308 - $533,000
4
Beds
3
Baths
2,458
Sq Ft
$209/Sq Ft
Est. Value
About This Home
This home is located at 11033 Karen Dr, Orland Park, IL 60467 and is currently estimated at $514,827, approximately $209 per square foot. 11033 Karen Dr is a home located in Cook County with nearby schools including Centennial School, Meadow Ridge School, and Century Junior High School.
Ownership History
Date
Name
Owned For
Owner Type
Purchase Details
Closed on
Jun 17, 2014
Sold by
Standard Bank & Trust Company
Bought by
Samars Michael R
Current Estimated Value
Home Financials for this Owner
Home Financials are based on the most recent Mortgage that was taken out on this home.
Original Mortgage
$285,000
Outstanding Balance
$216,123
Interest Rate
4.12%
Mortgage Type
New Conventional
Estimated Equity
$298,704
Purchase Details
Closed on
Jan 7, 2010
Sold by
Dangles Stanford and Dangles Carole
Bought by
Standard Bank & Trust Company and Trust #20746
Purchase Details
Closed on
Dec 19, 2000
Sold by
Standard Bank & Trust Company
Bought by
Dangles Stanford and Dangles Carole
Home Financials for this Owner
Home Financials are based on the most recent Mortgage that was taken out on this home.
Original Mortgage
$155,000
Interest Rate
7.69%
Create a Home Valuation Report for This Property
The Home Valuation Report is an in-depth analysis detailing your home's value as well as a comparison with similar homes in the area
Home Values in the Area
Average Home Value in this Area
Purchase History
| Date | Buyer | Sale Price | Title Company |
|---|---|---|---|
| Samars Michael R | $300,000 | Fidelity National Title | |
| Standard Bank & Trust Company | -- | First American Title Ins Co | |
| Dangles Stanford | $342,000 | Integrity Title |
Source: Public Records
Mortgage History
| Date | Status | Borrower | Loan Amount |
|---|---|---|---|
| Open | Samars Michael R | $285,000 | |
| Previous Owner | Dangles Stanford | $155,000 | |
| Closed | Dangles Stanford | $62,900 |
Source: Public Records
Tax History Compared to Growth
Tax History
| Year | Tax Paid | Tax Assessment Tax Assessment Total Assessment is a certain percentage of the fair market value that is determined by local assessors to be the total taxable value of land and additions on the property. | Land | Improvement |
|---|---|---|---|---|
| 2024 | $9,681 | $42,000 | $1,194 | $40,806 |
| 2023 | $8,845 | $42,000 | $1,194 | $40,806 |
| 2022 | $8,845 | $32,950 | $3,285 | $29,665 |
| 2021 | $8,569 | $32,948 | $3,284 | $29,664 |
| 2020 | $8,311 | $32,948 | $3,284 | $29,664 |
| 2019 | $8,820 | $35,562 | $2,986 | $32,576 |
| 2018 | $8,576 | $35,562 | $2,986 | $32,576 |
| 2017 | $8,398 | $35,562 | $2,986 | $32,576 |
| 2016 | $7,591 | $29,702 | $2,687 | $27,015 |
| 2015 | $7,483 | $29,702 | $2,687 | $27,015 |
| 2014 | $6,688 | $29,702 | $2,687 | $27,015 |
| 2013 | $6,576 | $30,915 | $2,687 | $28,228 |
Source: Public Records
Map
Nearby Homes
- 11156 Karen Dr
- 16221 Kingsport Rd
- 16400 Lee Ave
- 16430 Stuart Ave
- 11138 Alpine Ln
- 16540 Pear Ave
- 16546 Pear Ave
- 16464 Nottingham Ct Unit 19
- 16230 107th Ave
- 10700 165th St
- 16626 Pear Ave
- 16620 Grants Trail
- 15212 Penrose Ct
- 15160 Penrose Ct
- 15125 Penrose Ct
- 15106 Penrose Ct
- 15245 Penrose Ct
- 16629 Grants Trail
- 16705 Wolf Rd
- 11349 W 167th St
- 11037 Karen Dr Unit 11037
- 11041 Karen Dr Unit 11041
- 11045 Karen Dr
- 11060 Karen Dr
- 11051 Karen Dr
- 11100 Karen Dr
- 11055 Karen Dr Unit 11055
- 11059 Karen Dr Unit 11059
- 11101 Karen Dr Unit 11101
- 11105 Karen Dr Unit 11105
- 11105 Karen Dr Unit 1105
- 11109 Karen Dr Unit 11109
- 11118 Karen Dr
- 11114 Karen Dr
- 11114 Karen Dr Unit 1111
- 11114 Karen Dr Unit 14
- 11113 Karen Dr Unit 11113
- 11110 Karen Dr Unit 11110
- 11119 Karen Dr Unit 11119
- 16150 Kingsport Rd