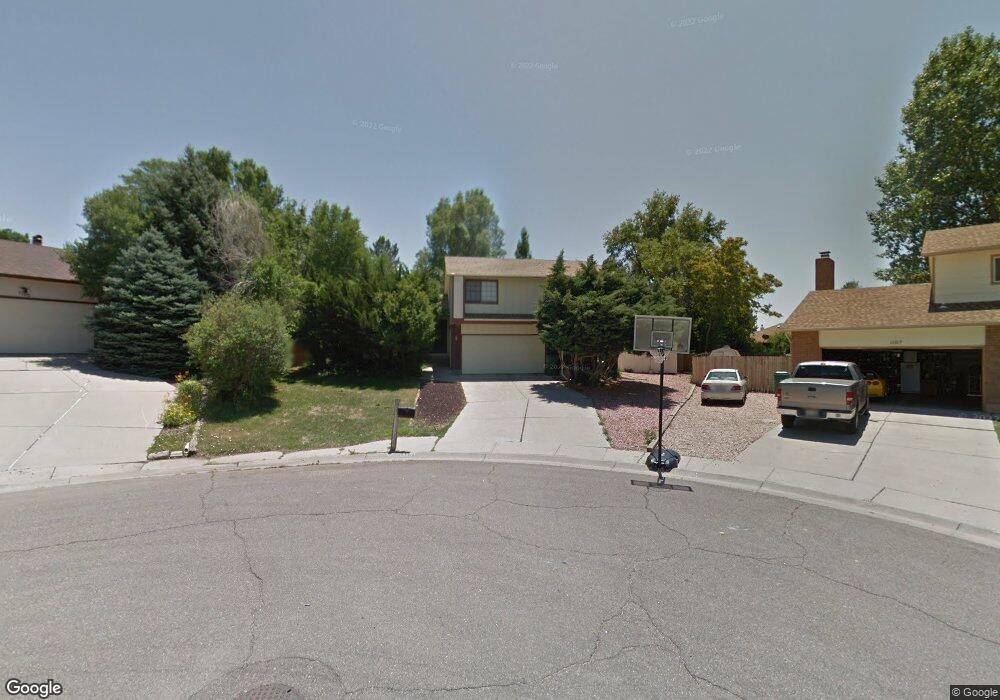
1104 Candytuft Ct Pueblo, CO 81001
University NeighborhoodEstimated Value: $337,534 - $434,000
3
Beds
3
Baths
2,178
Sq Ft
$179/Sq Ft
Est. Value
About This Home
This home is located at 1104 Candytuft Ct, Pueblo, CO 81001 and is currently estimated at $390,634, approximately $179 per square foot. 1104 Candytuft Ct is a home located in Pueblo County with nearby schools including Haaff Elementary School, Heaton Middle School, and East High School.
Ownership History
Date
Name
Owned For
Owner Type
Purchase Details
Closed on
Sep 17, 2025
Sold by
Malouff Francine A
Bought by
Malouff Francine A and Malouff Theodore J
Current Estimated Value
Purchase Details
Closed on
Mar 6, 2019
Sold by
Malouff Fradeine A
Bought by
Malouff Franeine A and Malouff Theedore J
Purchase Details
Closed on
Jan 15, 2013
Sold by
Malouff Theodore J and Malouff Francine A
Bought by
Malouff Francine A
Purchase Details
Closed on
Oct 25, 2012
Sold by
Malouff Theodore J
Bought by
Malouff Francine A
Purchase Details
Closed on
Feb 8, 1999
Sold by
Malouff Theodore J
Bought by
Malouff T J + F A
Purchase Details
Closed on
Sep 16, 1991
Sold by
Malouff Ted J + Jennifer N
Bought by
Malouff Theodore J
Purchase Details
Closed on
Aug 2, 1985
Sold by
Mecklenbrug Louis W + Ruth J
Bought by
Malouff Ted J + Jennifer N
Purchase Details
Closed on
May 9, 1980
Sold by
Freedom Homes Inc
Bought by
Mecklenbrug Louis W + Ruth J
Purchase Details
Closed on
Jun 4, 1979
Sold by
Otero Investment Inc
Bought by
Freedom Homes Inc
Create a Home Valuation Report for This Property
The Home Valuation Report is an in-depth analysis detailing your home's value as well as a comparison with similar homes in the area
Home Values in the Area
Average Home Value in this Area
Purchase History
| Date | Buyer | Sale Price | Title Company |
|---|---|---|---|
| Malouff Francine A | -- | None Listed On Document | |
| Malouff Franeine A | -- | None Available | |
| Malouff Francine A | -- | None Available | |
| Malouff Francine A | -- | None Available | |
| Malouff T J + F A | -- | -- | |
| Malouff Theodore J | -- | -- | |
| Malouff Ted J + Jennifer N | $89,500 | -- | |
| Mecklenbrug Louis W + Ruth J | $78,000 | -- | |
| Freedom Homes Inc | $26,000 | -- |
Source: Public Records
Tax History Compared to Growth
Tax History
| Year | Tax Paid | Tax Assessment Tax Assessment Total Assessment is a certain percentage of the fair market value that is determined by local assessors to be the total taxable value of land and additions on the property. | Land | Improvement |
|---|---|---|---|---|
| 2024 | $1,226 | $19,050 | -- | -- |
| 2023 | $1,240 | $22,740 | $2,350 | $20,390 |
| 2022 | $1,071 | $17,600 | $2,430 | $15,170 |
| 2021 | $1,104 | $18,100 | $2,500 | $15,600 |
| 2020 | $1,009 | $18,100 | $2,500 | $15,600 |
| 2019 | $1,009 | $17,014 | $1,859 | $15,155 |
| 2018 | $705 | $14,829 | $1,872 | $12,957 |
| 2017 | $712 | $14,829 | $1,872 | $12,957 |
| 2016 | $676 | $14,691 | $2,070 | $12,621 |
| 2015 | $674 | $14,691 | $2,070 | $12,621 |
| 2014 | $320 | $13,936 | $2,070 | $11,866 |
Source: Public Records
Map
Nearby Homes
- 1 Ironweed Dr
- 127 Ironweed Dr
- 911 Candytuft Blvd
- 6 Wallflower Ct
- 47 Ironweed Dr
- 4716 Scarlet Sage Dr
- 903 Blue Lace Dr
- 14 Erica Ct
- 4309 Blueflax Dr
- 4414 Turnberry Crescent
- 4720 Desert Candle Dr
- 3 St Andrews Ct
- 8 Cornflower Ct
- 9 Royal Troon Ct
- 1138 Bluestem Blvd
- 4808 Quita Ct
- 4230 Blueflax Dr
- 17 Terrace Dr
- L3 B3 Hero Way
- L6 B2 Hero Way
- 1106 Candytuft Ct
- 1102 Candytuft Ct
- 7 Ironweed Dr
- 8 Ironweed Dr
- 6 Ridgeweed Ct
- 5 Sweetpea Ct
- 9 Ironweed Dr
- 1012 Candytuft Blvd
- 1012 Candytuft Ct
- 1012 Candytuft Ct
- 1108 Candytuft Ct
- 1108 Candytuft Blvd
- 7 Ridgeweed Ct
- 4 Sweetpea Ct
- 10 Ironweed Dr
- 1110 Candytuft Ct
- 1110 Candytuft Ct
- 3 Sweetpea Ct
- 5 Ridgeweed Ct
- 2 Sweetpea Ct