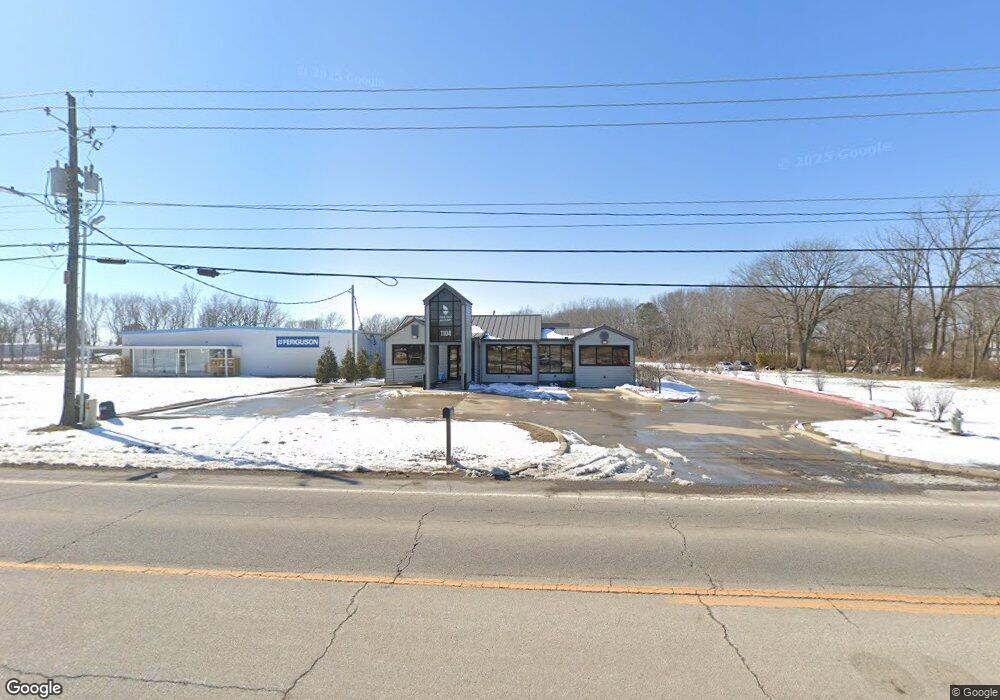
1104 N 2nd St Rogers, AR 72756
Estimated Value: $142,000
--
Bed
1
Bath
1,001
Sq Ft
$142/Sq Ft
Est. Value
About This Home
This home is located at 1104 N 2nd St, Rogers, AR 72756 and is currently priced at $142,000, approximately $141 per square foot. 1104 N 2nd St is a home located in Benton County with nearby schools including Northside Elementary School, Lingle Middle School, and Rogers Heritage High School.
Ownership History
Date
Name
Owned For
Owner Type
Purchase Details
Closed on
May 18, 2018
Sold by
Gravette Patsy L
Bought by
Hernandez Martinez Alfredo Reyes and Hernandez Garcia Leticia
Current Estimated Value
Purchase Details
Closed on
Jun 30, 1988
Bought by
Gravette
Purchase Details
Closed on
Sep 27, 1985
Bought by
Perusse
Purchase Details
Closed on
Aug 8, 1984
Bought by
Owen and Owen Houston
Purchase Details
Closed on
Aug 3, 1984
Bought by
Butler
Purchase Details
Closed on
May 9, 1984
Bought by
Houston & Owen
Purchase Details
Closed on
Jan 1, 1979
Bought by
Lyon
Purchase Details
Closed on
Aug 7, 1978
Bought by
Lyon
Create a Home Valuation Report for This Property
The Home Valuation Report is an in-depth analysis detailing your home's value as well as a comparison with similar homes in the area
Home Values in the Area
Average Home Value in this Area
Purchase History
| Date | Buyer | Sale Price | Title Company |
|---|---|---|---|
| Hernandez Martinez Alfredo Reyes | $115,000 | City Title & Closing Llc | |
| Gravette | $37,000 | -- | |
| Perusse | -- | -- | |
| Owen | -- | -- | |
| Butler | $35,000 | -- | |
| Houston & Owen | $24,000 | -- | |
| Lyon | -- | -- | |
| Lyon | $25,000 | -- |
Source: Public Records
Tax History Compared to Growth
Tax History
| Year | Tax Paid | Tax Assessment Tax Assessment Total Assessment is a certain percentage of the fair market value that is determined by local assessors to be the total taxable value of land and additions on the property. | Land | Improvement |
|---|---|---|---|---|
| 2025 | $7,119 | $182,766 | $24,035 | $158,731 |
| 2024 | $6,367 | $182,766 | $24,035 | $158,731 |
| 2023 | $5,789 | $109,426 | $24,035 | $85,391 |
| 2022 | $2,884 | $52,445 | $24,035 | $28,410 |
| 2021 | $2,960 | $53,960 | $25,550 | $28,410 |
| 2020 | $2,881 | $52,480 | $25,550 | $26,930 |
| 2019 | $754 | $13,740 | $4,040 | $9,700 |
| 2018 | $247 | $13,740 | $4,040 | $9,700 |
| 2017 | $215 | $13,740 | $4,040 | $9,700 |
| 2016 | $215 | $13,740 | $4,040 | $9,700 |
| 2015 | $576 | $10,880 | $4,440 | $6,440 |
| 2014 | $226 | $10,880 | $4,440 | $6,440 |
Source: Public Records
Map
Nearby Homes