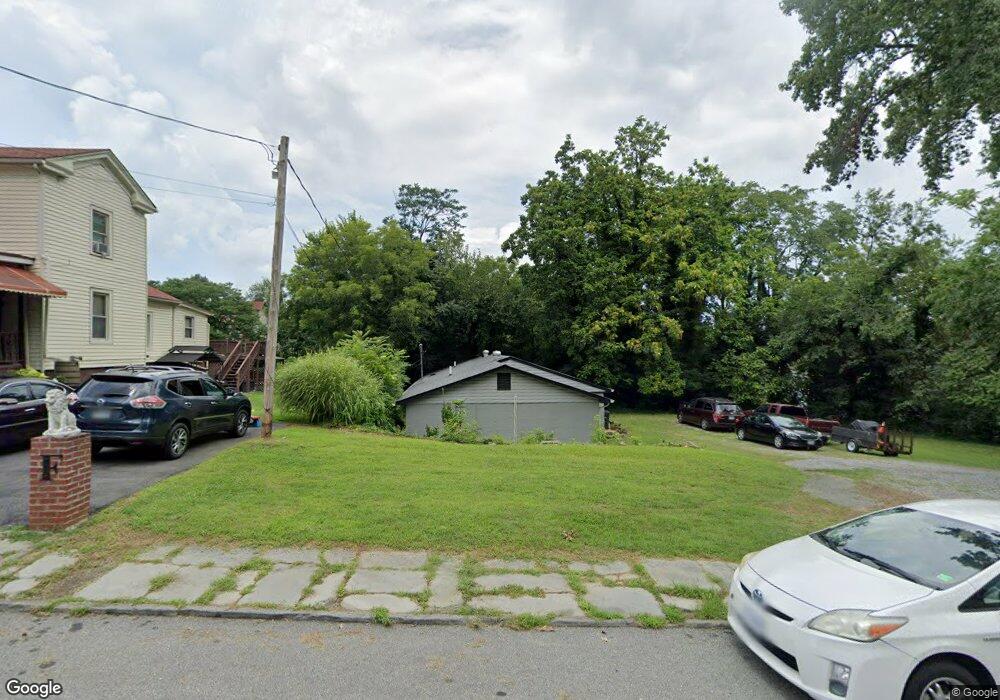
1105 11th St Lynchburg, VA 24504
College Hill NeighborhoodEstimated Value: $112,865 - $179,000
--
Bed
2
Baths
1,536
Sq Ft
$93/Sq Ft
Est. Value
About This Home
This home is located at 1105 11th St, Lynchburg, VA 24504 and is currently estimated at $143,216, approximately $93 per square foot. 1105 11th St is a home located in Lynchburg City with nearby schools including Perrymont Elementary School, Paul Laurence Dunbar Mid. for Innov., and Heritage High School.
Ownership History
Date
Name
Owned For
Owner Type
Purchase Details
Closed on
Mar 2, 2011
Sold by
Rush Lifetime Homes Inc
Bought by
Johnson Melissa M
Current Estimated Value
Home Financials for this Owner
Home Financials are based on the most recent Mortgage that was taken out on this home.
Original Mortgage
$33,750
Outstanding Balance
$23,323
Interest Rate
4.99%
Mortgage Type
Credit Line Revolving
Estimated Equity
$119,893
Purchase Details
Closed on
Nov 8, 2010
Sold by
Fort Early Partners Llc
Bought by
Rush Lifetime Homes Inc
Create a Home Valuation Report for This Property
The Home Valuation Report is an in-depth analysis detailing your home's value as well as a comparison with similar homes in the area
Home Values in the Area
Average Home Value in this Area
Purchase History
| Date | Buyer | Sale Price | Title Company |
|---|---|---|---|
| Johnson Melissa M | $45,000 | None Available | |
| Rush Lifetime Homes Inc | -- | None Available |
Source: Public Records
Mortgage History
| Date | Status | Borrower | Loan Amount |
|---|---|---|---|
| Open | Johnson Melissa M | $33,750 |
Source: Public Records
Tax History Compared to Growth
Tax History
| Year | Tax Paid | Tax Assessment Tax Assessment Total Assessment is a certain percentage of the fair market value that is determined by local assessors to be the total taxable value of land and additions on the property. | Land | Improvement |
|---|---|---|---|---|
| 2025 | $1,217 | $144,900 | $21,000 | $123,900 |
| 2024 | $685 | $77,000 | $19,600 | $57,400 |
| 2023 | $685 | $77,000 | $19,600 | $57,400 |
| 2022 | $690 | $67,000 | $14,000 | $53,000 |
| 2021 | $372 | $67,000 | $14,000 | $53,000 |
| 2020 | $617 | $55,600 | $12,000 | $43,600 |
| 2019 | $617 | $55,600 | $12,000 | $43,600 |
| 2018 | $593 | $53,400 | $12,000 | $41,400 |
| 2017 | $593 | $53,400 | $12,000 | $41,400 |
| 2016 | $593 | $53,400 | $12,000 | $41,400 |
| 2015 | $593 | $53,400 | $3,000 | $50,400 |
| 2014 | $593 | $72,200 | $3,000 | $69,200 |
Source: Public Records
Map
Nearby Homes