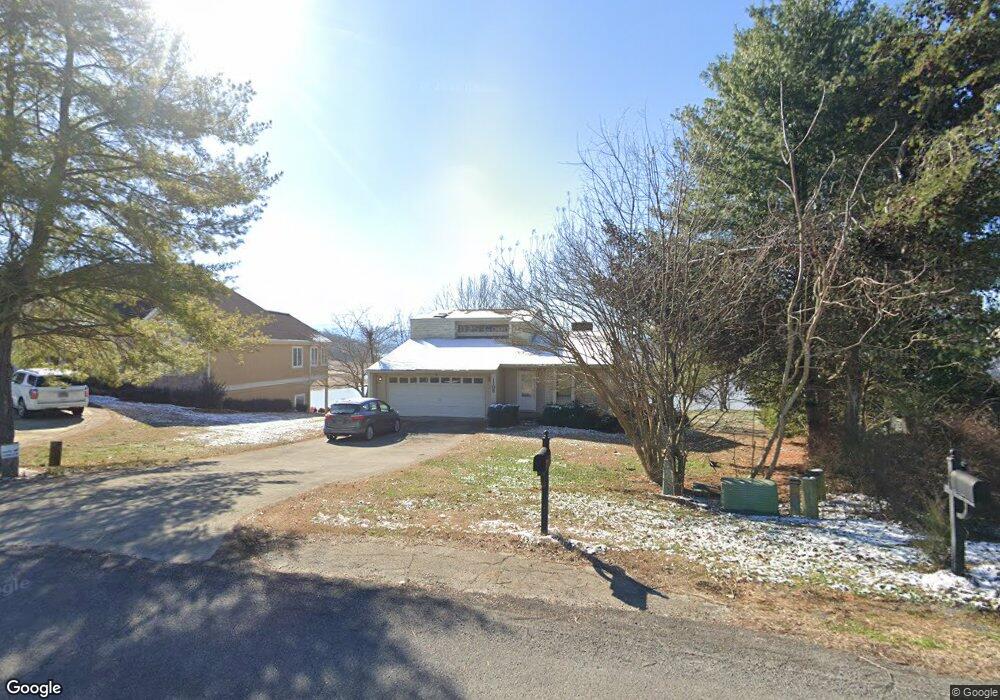
1105 Lake Ridge Dr Dandridge, TN 37725
Estimated Value: $613,391 - $1,083,000
--
Bed
3
Baths
1,312
Sq Ft
$601/Sq Ft
Est. Value
About This Home
This home is located at 1105 Lake Ridge Dr, Dandridge, TN 37725 and is currently estimated at $788,098, approximately $600 per square foot. 1105 Lake Ridge Dr is a home located in Jefferson County.
Ownership History
Date
Name
Owned For
Owner Type
Purchase Details
Closed on
Aug 7, 2003
Sold by
Rhonda Brenizer
Bought by
Harcke Sheryl M
Current Estimated Value
Purchase Details
Closed on
Jul 15, 2003
Sold by
Todd Brenizer
Bought by
Rhonda Brenizer
Purchase Details
Closed on
Jul 2, 2003
Bought by
Harcke Sheryl M Revocable Trust Sheryl Tru
Purchase Details
Closed on
Jan 7, 2003
Sold by
Harcke Sheryl M Revocable
Bought by
Rhonda Brenizer and Rhonda Todd
Home Financials for this Owner
Home Financials are based on the most recent Mortgage that was taken out on this home.
Original Mortgage
$351,000
Interest Rate
6.07%
Purchase Details
Closed on
Sep 28, 1995
Sold by
Diamond Charles W
Bought by
Richard Harcke
Purchase Details
Closed on
Jan 1, 1981
Bought by
Diamond Charles W & Alice Faye #122 Juli
Purchase Details
Closed on
Jul 11, 1979
Purchase Details
Closed on
Jan 1, 1979
Create a Home Valuation Report for This Property
The Home Valuation Report is an in-depth analysis detailing your home's value as well as a comparison with similar homes in the area
Home Values in the Area
Average Home Value in this Area
Purchase History
| Date | Buyer | Sale Price | Title Company |
|---|---|---|---|
| Harcke Sheryl M | $350,000 | -- | |
| Rhonda Brenizer | -- | -- | |
| Harcke Sheryl M Revocable Trust Sheryl Tru | -- | -- | |
| Rhonda Brenizer | $439,900 | -- | |
| Richard Harcke | $180,000 | -- | |
| Diamond Charles W & Alice Faye #122 Juli | $17,000 | -- | |
| -- | -- | -- | |
| -- | $13,000 | -- |
Source: Public Records
Mortgage History
| Date | Status | Borrower | Loan Amount |
|---|---|---|---|
| Previous Owner | Not Available | $351,000 |
Source: Public Records
Tax History Compared to Growth
Tax History
| Year | Tax Paid | Tax Assessment Tax Assessment Total Assessment is a certain percentage of the fair market value that is determined by local assessors to be the total taxable value of land and additions on the property. | Land | Improvement |
|---|---|---|---|---|
| 2025 | $2,304 | $143,775 | $87,500 | $56,275 |
| 2023 | $2,304 | $100,175 | $0 | $0 |
| 2022 | $2,194 | $100,175 | $72,500 | $27,675 |
| 2021 | $2,194 | $100,175 | $72,500 | $27,675 |
| 2020 | $2,194 | $100,175 | $72,500 | $27,675 |
| 2019 | $2,194 | $100,175 | $72,500 | $27,675 |
| 2018 | $2,280 | $97,025 | $72,500 | $24,525 |
| 2017 | $2,280 | $97,025 | $72,500 | $24,525 |
| 2016 | $2,280 | $97,025 | $72,500 | $24,525 |
| 2015 | $2,280 | $97,025 | $72,500 | $24,525 |
| 2014 | $2,280 | $97,025 | $72,500 | $24,525 |
Source: Public Records
Map
Nearby Homes
- 1101 Lake Ridge Dr
- 1107 Lake Ridge Dr
- 1097 Lake Ridge Dr
- Lot 39 Lake Ridge Dr
- 1095 Lake Ridge Dr
- 1113 Lake Ridge Dr
- 1115 Lake Ridge Dr
- 1093 Lake Ridge Dr
- 915 Barton Cir
- 1121 Lake Ridge Dr
- 1118 Lake Ridge Dr
- 1091 Lake Ridge Dr
- 1120 Lake Ridge Dr
- 0 Lots 43 & 44 Lake Ridge Dr Unit 253373
- 0 Lots 43 & 44 Lake Ridge Dr Unit 609346
- Lots 43 & 44 Lake Ridge Dr
- 1143 Lake Ridge Dr
- 1089 Lake Ridge Dr
- 1122 Lake Ridge Dr
- 1085 Lake Ridge Dr