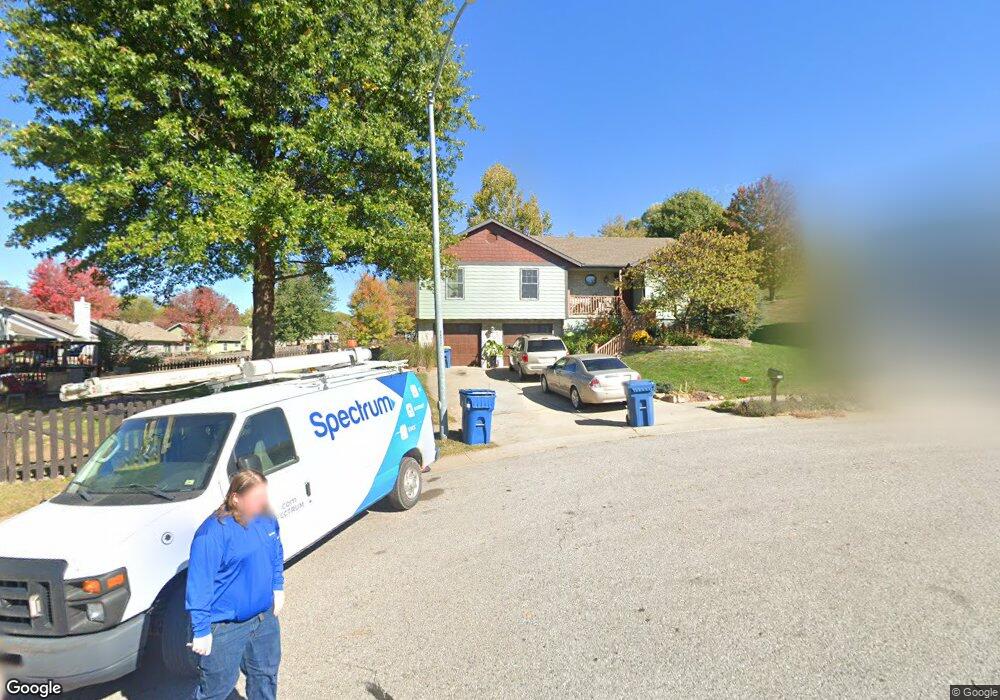
1106 Current Place Liberty, MO 64068
Estimated Value: $303,000 - $323,000
3
Beds
2
Baths
1,350
Sq Ft
$230/Sq Ft
Est. Value
About This Home
This home is located at 1106 Current Place, Liberty, MO 64068 and is currently estimated at $310,383, approximately $229 per square foot. 1106 Current Place is a home located in Clay County with nearby schools including Lillian Schumacher Elementary School, Liberty Middle School, and Liberty High School.
Ownership History
Date
Name
Owned For
Owner Type
Purchase Details
Closed on
Sep 27, 2000
Sold by
Federal Home Loan Mortgage Corporation
Bought by
Schuele Christopher D and Schuele Jennifer L
Current Estimated Value
Home Financials for this Owner
Home Financials are based on the most recent Mortgage that was taken out on this home.
Original Mortgage
$103,500
Outstanding Balance
$37,880
Interest Rate
7.97%
Estimated Equity
$272,503
Purchase Details
Closed on
Aug 21, 2000
Sold by
Atlantic Mtg & Investment Corp
Bought by
Federal Home Loan Mortgage Corporation
Home Financials for this Owner
Home Financials are based on the most recent Mortgage that was taken out on this home.
Original Mortgage
$103,500
Outstanding Balance
$37,880
Interest Rate
7.97%
Estimated Equity
$272,503
Purchase Details
Closed on
Jun 27, 2000
Sold by
Little Eric P
Bought by
Atlantic Mtg & Investment Corp
Create a Home Valuation Report for This Property
The Home Valuation Report is an in-depth analysis detailing your home's value as well as a comparison with similar homes in the area
Home Values in the Area
Average Home Value in this Area
Purchase History
| Date | Buyer | Sale Price | Title Company |
|---|---|---|---|
| Schuele Christopher D | -- | First American Title | |
| Federal Home Loan Mortgage Corporation | -- | Mokan Title Services | |
| Atlantic Mtg & Investment Corp | $110,095 | -- |
Source: Public Records
Mortgage History
| Date | Status | Borrower | Loan Amount |
|---|---|---|---|
| Open | Schuele Christopher D | $103,500 |
Source: Public Records
Tax History Compared to Growth
Tax History
| Year | Tax Paid | Tax Assessment Tax Assessment Total Assessment is a certain percentage of the fair market value that is determined by local assessors to be the total taxable value of land and additions on the property. | Land | Improvement |
|---|---|---|---|---|
| 2025 | $2,939 | $43,910 | -- | -- |
| 2024 | $2,939 | $38,210 | -- | -- |
| 2023 | $2,989 | $38,210 | $0 | $0 |
| 2022 | $2,768 | $34,940 | $0 | $0 |
| 2021 | $2,746 | $34,941 | $6,650 | $28,291 |
| 2020 | $2,472 | $29,530 | $0 | $0 |
| 2019 | $2,471 | $29,526 | $4,940 | $24,586 |
| 2018 | $2,348 | $27,550 | $0 | $0 |
| 2017 | $2,241 | $27,550 | $3,990 | $23,560 |
| 2016 | $2,241 | $26,540 | $3,990 | $22,550 |
| 2015 | $2,241 | $26,540 | $3,990 | $22,550 |
| 2014 | $2,169 | $25,480 | $3,990 | $21,490 |
Source: Public Records
Map
Nearby Homes
- 1905 Claywoods Pkwy
- 1847 Mallard Dr
- 1103 Pier
- 1876 Kingbird Ln
- 1872 Kingbird Ln
- 3.86 acres Southview Dr
- 1004 Hackberry Ct
- 1435 Sumac Cir
- 2504 Magnolia Ave
- 345 Cates Ct
- 450 E Ruth Ewing Rd
- 1116 Silverleaf Ln
- 1059 Fir Ln
- 1112 White Birch St
- 1051 Fir Ln
- 1044 Silverleaf Ln
- 1024 Redwood Ln
- 1015 Poplar Ln
- 1011 Poplar Ln
- 1007 Poplar Ln
- 1110 Current Place
- 1916 Current St
- 1912 Current St
- 1908 Current St
- 1891 Quail Ridge Ct
- 1111 Current Place
- 1887 Quail Ridge Ct
- 1904 Current St
- 1901 Quail Ridge Ct
- 1107 Current Place
- 1930 Current St
- 1900 Current St
- 1883 Quail Ridge Ct
- 1890 Current St
- 1917 Current St
- 1921 Current St
- 1905 Quail Ridge Ct
- 1913 Current St
- 1884 Current St
- 1925 Current St