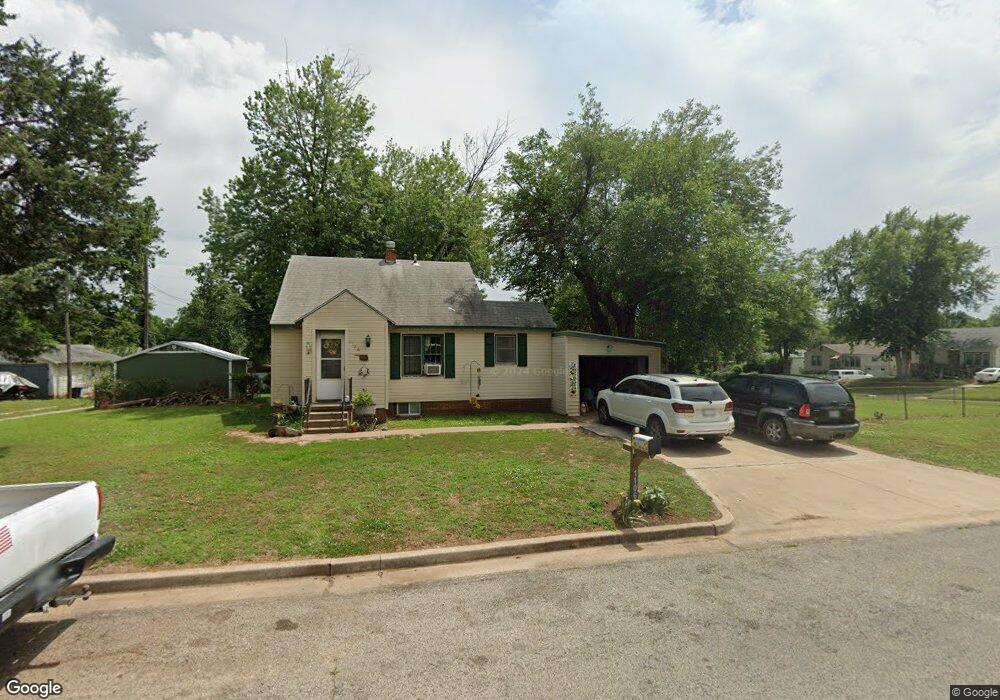
1106 E Oklahoma Ave Ponca City, OK 74601
Estimated Value: $47,000 - $108,000
2
Beds
1
Bath
1,430
Sq Ft
$53/Sq Ft
Est. Value
About This Home
This home is located at 1106 E Oklahoma Ave, Ponca City, OK 74601 and is currently estimated at $75,788, approximately $52 per square foot. 1106 E Oklahoma Ave is a home located in Kay County with nearby schools including Garfield Elementary School, Ponca City East Middle School, and Ponca City West Middle School.
Ownership History
Date
Name
Owned For
Owner Type
Purchase Details
Closed on
Dec 14, 2021
Sold by
Stolhand James R and Stolhand Sunie D
Bought by
Pruett Cynthia Lee
Current Estimated Value
Home Financials for this Owner
Home Financials are based on the most recent Mortgage that was taken out on this home.
Original Mortgage
$52,320
Interest Rate
10%
Mortgage Type
Land Contract Argmt. Of Sale
Purchase Details
Closed on
Apr 12, 2021
Sold by
Carson Crissie L
Bought by
Stolhand James R and Stolhand Sunie D
Purchase Details
Closed on
Apr 12, 2005
Sold by
Stolhand James R and Stolhand Sunie D
Bought by
Carson Crissie L
Purchase Details
Closed on
Jul 20, 2000
Sold by
Bank Okla Mtg Co
Bought by
Sunnie James and Sunnie Stolhand
Purchase Details
Closed on
Dec 21, 1998
Sold by
Bank Okla Mtg Co
Bought by
Sunnie James and Sunnie Stolhand
Purchase Details
Closed on
Jun 12, 1998
Bought by
Bank Okla Mtg Co
Purchase Details
Closed on
Feb 2, 1996
Create a Home Valuation Report for This Property
The Home Valuation Report is an in-depth analysis detailing your home's value as well as a comparison with similar homes in the area
Home Values in the Area
Average Home Value in this Area
Purchase History
| Date | Buyer | Sale Price | Title Company |
|---|---|---|---|
| Pruett Cynthia Lee | $36,000 | None Available | |
| Stolhand James R | $30,000 | None Available | |
| Carson Crissie L | -- | -- | |
| Sunnie James | -- | -- | |
| Sunnie James | $25,000 | -- | |
| Bank Okla Mtg Co | -- | -- | |
| -- | $35,000 | -- |
Source: Public Records
Mortgage History
| Date | Status | Borrower | Loan Amount |
|---|---|---|---|
| Closed | Pruett Cynthia Lee | $52,320 |
Source: Public Records
Tax History Compared to Growth
Tax History
| Year | Tax Paid | Tax Assessment Tax Assessment Total Assessment is a certain percentage of the fair market value that is determined by local assessors to be the total taxable value of land and additions on the property. | Land | Improvement |
|---|---|---|---|---|
| 2024 | $262 | $3,767 | $668 | $3,099 |
| 2023 | $262 | $3,658 | $668 | $2,990 |
| 2022 | $331 | $3,483 | $668 | $2,815 |
| 2021 | $333 | $3,483 | $668 | $2,815 |
| 2020 | $330 | $3,483 | $668 | $2,815 |
| 2019 | $317 | $3,318 | $668 | $2,650 |
| 2018 | $321 | $3,318 | $668 | $2,650 |
| 2017 | $325 | $3,318 | $668 | $2,650 |
| 2016 | $329 | $3,318 | $668 | $2,650 |
| 2015 | $331 | $3,323 | $668 | $2,655 |
| 2014 | $325 | $3,326 | $668 | $2,658 |
Source: Public Records
Map
Nearby Homes
- 310 S 9th St
- 213 N 10th St
- 216 N 12th St Unit 840
- 701 S 8th St
- 800 S 12th St
- 202 N 7th St
- 310 N 7th St Unit 660
- 410 Drake Dr
- 408 S 4th St
- 1001 S 9th St
- 409 N 5th St
- 815 E Madison Ave
- 1020 S 8th St
- 212 E Ponca Ave
- 525 Monument Rd
- 417 S 2nd St
- 1103 S 6th St
- 417 N 3rd St
- 1220 S 8th St Unit 480
- 1300 S 8th St
- 309 S 11th St
- 1114 E Oklahoma Ave
- 313 S 11th St
- 219 S 11th St Unit 80
- 308 S 12th St
- 300 S 12th St
- 1113 E Oklahoma Ave
- 314 S 12th St
- 317 S 11th St
- 300 S 11th St Unit 80
- 304 S 11th St
- 218 S 12th St
- 306 S 11th St
- 321 S 11th St
- 211 S 11th St
- 316 S 12th St
- 312 S 11th St
- 318 S 11th St
- 218 S 11th St
- 212 S 12th St