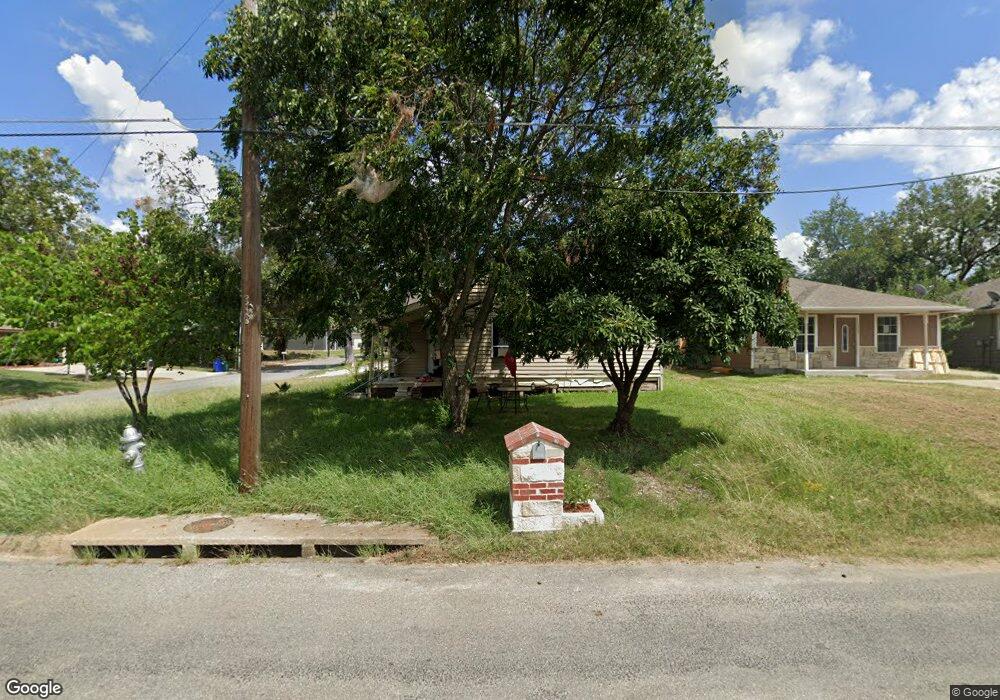
1107 N Branch St Sherman, TX 75090
Estimated Value: $151,434 - $178,000
--
Bed
1
Bath
1,042
Sq Ft
$158/Sq Ft
Est. Value
About This Home
This home is located at 1107 N Branch St, Sherman, TX 75090 and is currently estimated at $164,717, approximately $158 per square foot. 1107 N Branch St is a home located in Grayson County with nearby schools including Wakefield Elementary School, Piner Middle School, and Dillingham Intermediate School.
Ownership History
Date
Name
Owned For
Owner Type
Purchase Details
Closed on
Aug 24, 2014
Sold by
Ugalde Alejandro
Bought by
Salazar Alicia
Current Estimated Value
Purchase Details
Closed on
Aug 12, 2008
Sold by
Himmelreich Dale and S & D Properties
Bought by
Torres Cruz and Torres Martha Gonzales
Home Financials for this Owner
Home Financials are based on the most recent Mortgage that was taken out on this home.
Original Mortgage
$26,500
Interest Rate
6.29%
Mortgage Type
Purchase Money Mortgage
Purchase Details
Closed on
May 8, 2008
Sold by
Gamez German
Bought by
Himmelreich Dale and S & D Properties
Purchase Details
Closed on
Oct 31, 2006
Sold by
Himmelreich Dale
Bought by
Gomez German
Home Financials for this Owner
Home Financials are based on the most recent Mortgage that was taken out on this home.
Original Mortgage
$32,000
Interest Rate
6.07%
Mortgage Type
Purchase Money Mortgage
Create a Home Valuation Report for This Property
The Home Valuation Report is an in-depth analysis detailing your home's value as well as a comparison with similar homes in the area
Home Values in the Area
Average Home Value in this Area
Purchase History
| Date | Buyer | Sale Price | Title Company |
|---|---|---|---|
| Salazar Alicia | -- | Red River Title Co | |
| Torres Cruz | -- | None Available | |
| Himmelreich Dale | -- | None Available | |
| Gomez German | -- | None Available |
Source: Public Records
Mortgage History
| Date | Status | Borrower | Loan Amount |
|---|---|---|---|
| Previous Owner | Torres Cruz | $26,500 | |
| Previous Owner | Gomez German | $32,000 |
Source: Public Records
Tax History Compared to Growth
Tax History
| Year | Tax Paid | Tax Assessment Tax Assessment Total Assessment is a certain percentage of the fair market value that is determined by local assessors to be the total taxable value of land and additions on the property. | Land | Improvement |
|---|---|---|---|---|
| 2025 | $2,672 | $119,298 | $33,009 | $86,289 |
| 2024 | $2,672 | $121,806 | $32,627 | $89,179 |
| 2023 | $3,192 | $145,372 | $27,989 | $117,383 |
| 2022 | $2,727 | $116,375 | $13,367 | $103,008 |
| 2021 | $2,334 | $93,124 | $15,495 | $77,629 |
| 2020 | $1,423 | $54,219 | $8,457 | $45,762 |
| 2019 | $1,387 | $51,466 | $6,438 | $45,028 |
| 2018 | $1,258 | $50,158 | $4,583 | $45,575 |
| 2017 | $1,032 | $41,439 | $5,468 | $35,971 |
| 2016 | $991 | $39,819 | $5,468 | $34,351 |
| 2015 | $830 | $33,427 | $2,344 | $31,083 |
| 2014 | $327 | $22,852 | $1,562 | $21,290 |
Source: Public Records
Map
Nearby Homes
- 0 Vernon Holland Memorial Dr
- 1021 N Branch St
- 1013 N Branch St
- 209 E College St
- 905 N Music St
- TBD Sam Rayburn
- 819 N Walnut St Unit 821
- 810 N Walnut St
- 800 N Broughton St
- 1212 N Throckmorton St
- 514 E Brockett St Unit 516
- 520 E Brockett St
- .25 ACRES N Montgomery St
- 304-316 E Pacific St Unit 316
- 515 N East St
- 1023 N Leslie Ave
- 812 N Willow St
- 715 N Elm St
- 311 W Scott St
- 1018 N Woods St
- 1105 N Branch St
- TBD E Kerr St
- 407 E Vernon Holland Dr
- 1101 N Branch St
- 401 Vernon Holland Memorial Dr
- 416 Vernon Holland Memorial Dr
- 407 Vernon Holland Memorial Dr
- 1104 N Branch St
- 1006 N East St
- 1010 N East St
- 411 E Vernon Holland
- 1024 N Branch St
- 411 Vernon Holland Memorial Dr
- 1209 N Branch St
- 1016 N Branch St
- 1002 N East St
- 1200 N East St
- 410 E Evergreen St
- 412 E Evergreen St
- 501 Vernon Holland Memorial Dr