1109 N 4350th Rd Earlville, IL 60518
Estimated Value: $136,000 - $174,000
--
Bed
--
Bath
1,431
Sq Ft
$108/Sq Ft
Est. Value
About This Home
This home is located at 1109 N 4350th Rd, Earlville, IL 60518 and is currently estimated at $153,940, approximately $107 per square foot. 1109 N 4350th Rd is a home located in LaSalle County with nearby schools including Earlville Elementary School and Earlville Junior/Senior High School.
Ownership History
Date
Name
Owned For
Owner Type
Purchase Details
Closed on
Dec 31, 2010
Sold by
Enck Robert B
Bought by
Copper Jennifer L
Current Estimated Value
Purchase Details
Closed on
Jun 25, 2010
Sold by
Larimer Randee Lea
Bought by
Enck Robert B and Coppes Jennifer L
Home Financials for this Owner
Home Financials are based on the most recent Mortgage that was taken out on this home.
Original Mortgage
$106,000
Interest Rate
6.75%
Mortgage Type
Construction
Create a Home Valuation Report for This Property
The Home Valuation Report is an in-depth analysis detailing your home's value as well as a comparison with similar homes in the area
Home Values in the Area
Average Home Value in this Area
Purchase History
| Date | Buyer | Sale Price | Title Company |
|---|---|---|---|
| Copper Jennifer L | -- | None Available | |
| Enck Robert B | $75,000 | None Available |
Source: Public Records
Mortgage History
| Date | Status | Borrower | Loan Amount |
|---|---|---|---|
| Previous Owner | Enck Robert B | $106,000 |
Source: Public Records
Tax History Compared to Growth
Tax History
| Year | Tax Paid | Tax Assessment Tax Assessment Total Assessment is a certain percentage of the fair market value that is determined by local assessors to be the total taxable value of land and additions on the property. | Land | Improvement |
|---|---|---|---|---|
| 2024 | $2,507 | $31,051 | $28,685 | $2,366 |
| 2023 | $2,283 | $27,214 | $25,140 | $2,074 |
| 2022 | $1,769 | $20,423 | $18,448 | $1,975 |
| 2021 | $1,711 | $19,137 | $17,286 | $1,851 |
| 2020 | $1,601 | $17,927 | $16,193 | $1,734 |
| 2019 | $1,562 | $17,241 | $15,573 | $1,668 |
| 2018 | $1,461 | $15,890 | $14,353 | $1,537 |
| 2017 | $1,342 | $14,302 | $12,919 | $1,383 |
| 2016 | $1,270 | $13,349 | $12,058 | $1,291 |
| 2015 | $679 | $14,272 | $12,892 | $1,380 |
| 2012 | -- | $20,315 | $17,106 | $3,209 |
Source: Public Records
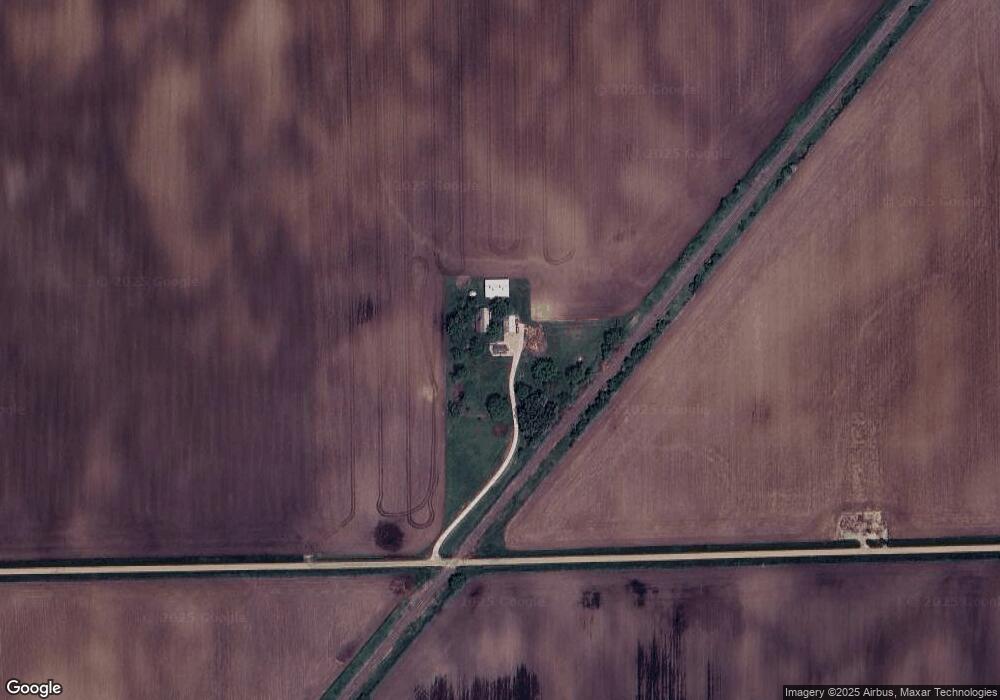
Map
Nearby Homes