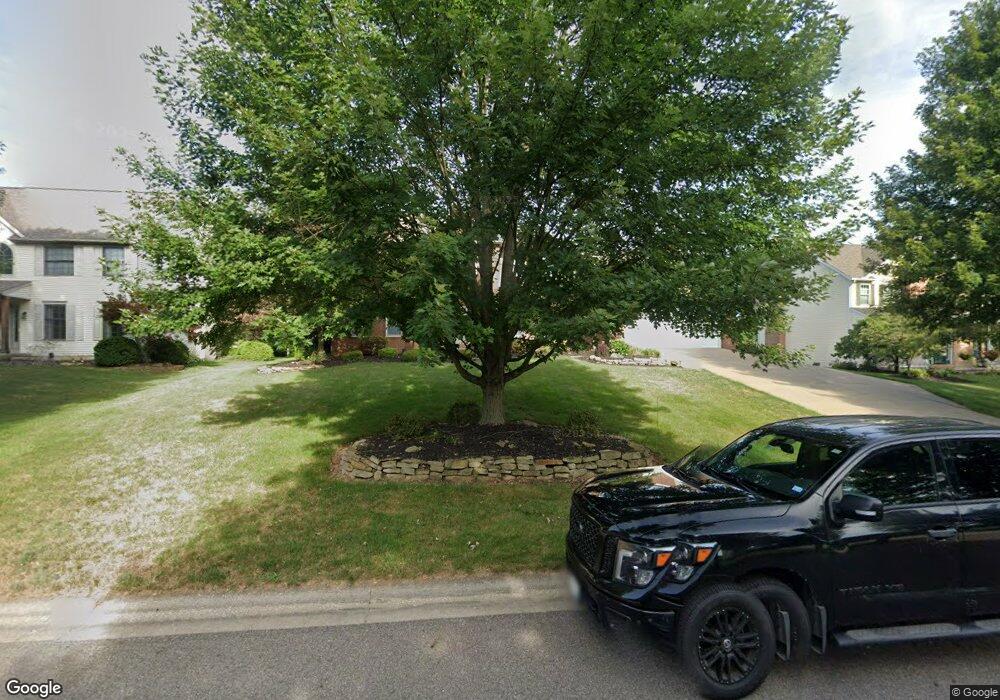
11099 Bancroft Ave NW Uniontown, OH 44685
Estimated Value: $499,000 - $619,141
4
Beds
4
Baths
3,140
Sq Ft
$180/Sq Ft
Est. Value
About This Home
This home is located at 11099 Bancroft Ave NW, Uniontown, OH 44685 and is currently estimated at $566,285, approximately $180 per square foot. 11099 Bancroft Ave NW is a home located in Stark County with nearby schools including North Canton Middle School, Hoover High School, and Mayfair Christian School.
Ownership History
Date
Name
Owned For
Owner Type
Purchase Details
Closed on
Jul 15, 2020
Sold by
Keller Brian F
Bought by
Nida Craig A and Nida Tracy L
Current Estimated Value
Home Financials for this Owner
Home Financials are based on the most recent Mortgage that was taken out on this home.
Original Mortgage
$363,850
Outstanding Balance
$322,638
Interest Rate
3.1%
Mortgage Type
New Conventional
Estimated Equity
$243,647
Purchase Details
Closed on
Jun 14, 2000
Sold by
Keller Brian F and Keller Jill A
Bought by
Keller Jill A and The Jill A Keller Revocable Trust
Purchase Details
Closed on
Jul 29, 1999
Sold by
Chatham Development Corp
Bought by
Keller Brian F and Keller Jill A
Home Financials for this Owner
Home Financials are based on the most recent Mortgage that was taken out on this home.
Original Mortgage
$175,000
Interest Rate
6.87%
Mortgage Type
Construction
Create a Home Valuation Report for This Property
The Home Valuation Report is an in-depth analysis detailing your home's value as well as a comparison with similar homes in the area
Home Values in the Area
Average Home Value in this Area
Purchase History
| Date | Buyer | Sale Price | Title Company |
|---|---|---|---|
| Nida Craig A | $383,000 | None Available | |
| Keller Jill A | -- | -- | |
| Keller Brian F | -- | -- | |
| Keller Brian F | $52,400 | -- |
Source: Public Records
Mortgage History
| Date | Status | Borrower | Loan Amount |
|---|---|---|---|
| Open | Nida Craig A | $363,850 | |
| Previous Owner | Keller Brian F | $175,000 |
Source: Public Records
Tax History Compared to Growth
Tax History
| Year | Tax Paid | Tax Assessment Tax Assessment Total Assessment is a certain percentage of the fair market value that is determined by local assessors to be the total taxable value of land and additions on the property. | Land | Improvement |
|---|---|---|---|---|
| 2025 | -- | $179,030 | $24,430 | $154,600 |
| 2024 | -- | $214,310 | $24,430 | $189,880 |
| 2023 | $7,141 | $134,060 | $20,690 | $113,370 |
| 2022 | $6,850 | $134,060 | $20,690 | $113,370 |
| 2021 | $7,045 | $134,060 | $20,690 | $113,370 |
| 2020 | $5,578 | $96,750 | $17,820 | $78,930 |
| 2019 | $5,224 | $96,750 | $17,820 | $78,930 |
| 2018 | $5,410 | $96,750 | $17,820 | $78,930 |
| 2017 | $4,662 | $87,720 | $19,150 | $68,570 |
| 2016 | $4,680 | $87,720 | $19,150 | $68,570 |
| 2015 | $4,698 | $87,720 | $19,150 | $68,570 |
| 2014 | $321 | $76,300 | $16,660 | $59,640 |
| 2013 | $2,162 | $76,300 | $16,660 | $59,640 |
Source: Public Records
Map
Nearby Homes
- 11065 Dunsby Ave NW
- 11056 Peach Glen Ave NW
- 3851 Cromford Cir NW
- 3863 Heckman St NW
- 3475 Heckman St NW
- 11316 Cleveland Ave NW
- 0 Heckman St NW Unit 5154708
- 4943 Mayfair Rd
- 4786 Mayfair Rd
- 10380 Sudbury Cir NW
- 10531 Newbury Ave NW
- 3048 Wright Rd NW
- 3026 Wright Rd NW
- 2845 Byron Dr
- Sarasota Plan at Spring Hill - Spring Hill Villas
- Chester Plan at Spring Hill - Spring Hill Villas
- Kenai Plan at Spring Hill - Spring Hill Villas
- Holston Plan at Spring Hill - Spring Hill Villas
- Bradbern Plan at Spring Hill - Spring Hill Villas
- Northwood Plan at Spring Hill - Spring Hill Villas
- 11121 Bancroft Ave NW
- 11081 Bancroft Ave NW
- 11139 Bancroft Ave NW
- 11063 Bancroft Ave NW
- 3869 Kippford Cir NW
- 3876 Kippford Cir NW
- 11108 Bancroft Ave NW
- 11090 Bancroft Ave NW
- 11157 Bancroft Ave NW
- 11045 Bancroft Ave NW
- 11068 Bancroft Ave NW
- 11130 Bancroft Ave NW
- 3868 Kippford Cir NW
- 3861 Kippford Cir NW
- 11052 Bancroft Ave NW
- 3931 Chawton St NW
- 3847 Kippford Cir NW
- 11191 Bancroft Ave NW
- 11025 Bancroft Ave NW
- 3990 Corby St NW