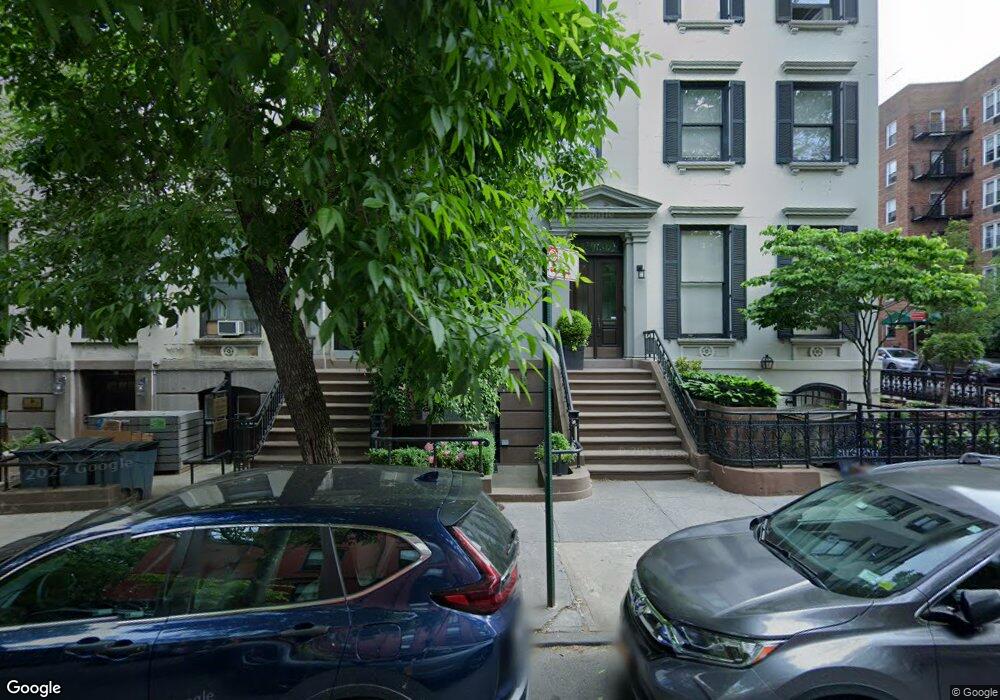
111 Joralemon St Brooklyn, NY 11201
Brooklyn Heights NeighborhoodEstimated Value: $5,283,000 - $9,040,342
--
Bed
--
Bath
5,605
Sq Ft
$1,265/Sq Ft
Est. Value
About This Home
This home is located at 111 Joralemon St, Brooklyn, NY 11201 and is currently estimated at $7,089,781, approximately $1,264 per square foot. 111 Joralemon St is a home located in Kings County with nearby schools including P.S. 8 Robert Fulton, Brooklyn Laboratory Charter School, and Guidepost Montessori at Brooklyn Heights.
Ownership History
Date
Name
Owned For
Owner Type
Purchase Details
Closed on
Sep 5, 2007
Sold by
Monroe Elizabeth M and Monroe Stephen A
Bought by
Germain Jennifer and Germain Paul
Current Estimated Value
Home Financials for this Owner
Home Financials are based on the most recent Mortgage that was taken out on this home.
Original Mortgage
$225,000
Outstanding Balance
$142,892
Interest Rate
6.63%
Estimated Equity
$6,946,889
Purchase Details
Closed on
Mar 13, 2006
Sold by
Carlson Janet Trus and Citigroup Trust-Delaware Na
Bought by
Monroe Elizabeth M and Monroe Stephen A
Home Financials for this Owner
Home Financials are based on the most recent Mortgage that was taken out on this home.
Original Mortgage
$2,422,500
Interest Rate
6.28%
Mortgage Type
Purchase Money Mortgage
Purchase Details
Closed on
Aug 1, 2002
Sold by
Carlson Janet
Bought by
Carlson Janet and Carlson Tr
Purchase Details
Closed on
Dec 26, 1996
Sold by
Gotbaum Elisabeth
Bought by
Anglin Helen
Home Financials for this Owner
Home Financials are based on the most recent Mortgage that was taken out on this home.
Original Mortgage
$500,000
Interest Rate
6.87%
Create a Home Valuation Report for This Property
The Home Valuation Report is an in-depth analysis detailing your home's value as well as a comparison with similar homes in the area
Home Values in the Area
Average Home Value in this Area
Purchase History
| Date | Buyer | Sale Price | Title Company |
|---|---|---|---|
| Germain Jennifer | $4,500,000 | -- | |
| Germain Jennifer | $4,500,000 | -- | |
| Monroe Elizabeth M | $2,850,000 | -- | |
| Monroe Elizabeth M | $2,850,000 | -- | |
| Carlson Janet | -- | -- | |
| Carlson Janet | -- | -- | |
| Anglin Helen | $900,000 | -- | |
| Anglin Helen | $900,000 | -- |
Source: Public Records
Mortgage History
| Date | Status | Borrower | Loan Amount |
|---|---|---|---|
| Open | Germain Jennifer | $225,000 | |
| Closed | Germain Jennifer | $225,000 | |
| Open | Germain Jennifer | $3,375,000 | |
| Closed | Germain Jennifer | $3,375,000 | |
| Previous Owner | Monroe Elizabeth M | $2,422,500 | |
| Previous Owner | Anglin Helen | $500,000 |
Source: Public Records
Tax History Compared to Growth
Tax History
| Year | Tax Paid | Tax Assessment Tax Assessment Total Assessment is a certain percentage of the fair market value that is determined by local assessors to be the total taxable value of land and additions on the property. | Land | Improvement |
|---|---|---|---|---|
| 2025 | $41,588 | $523,560 | $66,840 | $456,720 |
| 2024 | $41,588 | $529,560 | $66,840 | $462,720 |
| 2023 | $41,588 | $550,560 | $66,840 | $483,720 |
| 2022 | $40,204 | $534,120 | $66,840 | $467,280 |
| 2021 | $32,203 | $720,600 | $66,840 | $653,760 |
| 2020 | $15,105 | $729,000 | $66,840 | $662,160 |
| 2019 | $28,630 | $579,600 | $66,840 | $512,760 |
| 2018 | $27,899 | $136,861 | $22,851 | $114,010 |
| 2017 | $26,354 | $129,279 | $20,939 | $108,340 |
| 2016 | $25,492 | $127,516 | $21,029 | $106,487 |
| 2015 | $14,710 | $120,322 | $25,528 | $94,794 |
| 2014 | $14,710 | $114,051 | $21,474 | $92,577 |
Source: Public Records
Map
Nearby Homes
- 103 Joralemon St
- 222 Henry St
- 100 Remsen St Unit 3C
- 76 Remsen St Unit 6B
- 261 Hicks St
- 12 Sidney Place
- 70 Remsen St Unit 4F
- 70 Remsen St Unit 7H
- 70 Remsen St Unit 8F
- 70 Remsen St Unit 6J
- 70 Remsen St Unit 10E
- 70 Remsen St Unit 7J
- 137 Joralemon St Unit PARLOR
- 137 Joralemon St
- 137 Joralemon St Unit 6
- 60 Remsen St Unit 3G
- 118 Remsen St Unit 2
- 132 Joralemon St Unit 5BC
- 260 Hicks St
- 29 Garden Place
- 109 Joralemon St Unit 6
- 109 Joralemon St Unit 3
- 109 Joralemon St Unit 7
- 109 Joralemon St Unit 5
- 109 Joralemon St Unit 8
- 109 Joralemon St Unit 12
- 109 Joralemon St Unit 10
- 109 Joralemon St Unit 9
- 107 Joralemon St Unit 9
- 107 Joralemon St Unit 5
- 107 Joralemon St
- 107 Joralemon St Unit 6
- 107 Joralemon St Unit THREE
- 107 Joralemon St Unit 3
- 107 Joralemon St Unit 2
- 107 Joralemon St Unit 7
- 107 Joralemon St Unit 8
- 107 Joralemon St Unit 5
- 107 Joralemon St Unit 5F
- 236 Henry St Unit 8