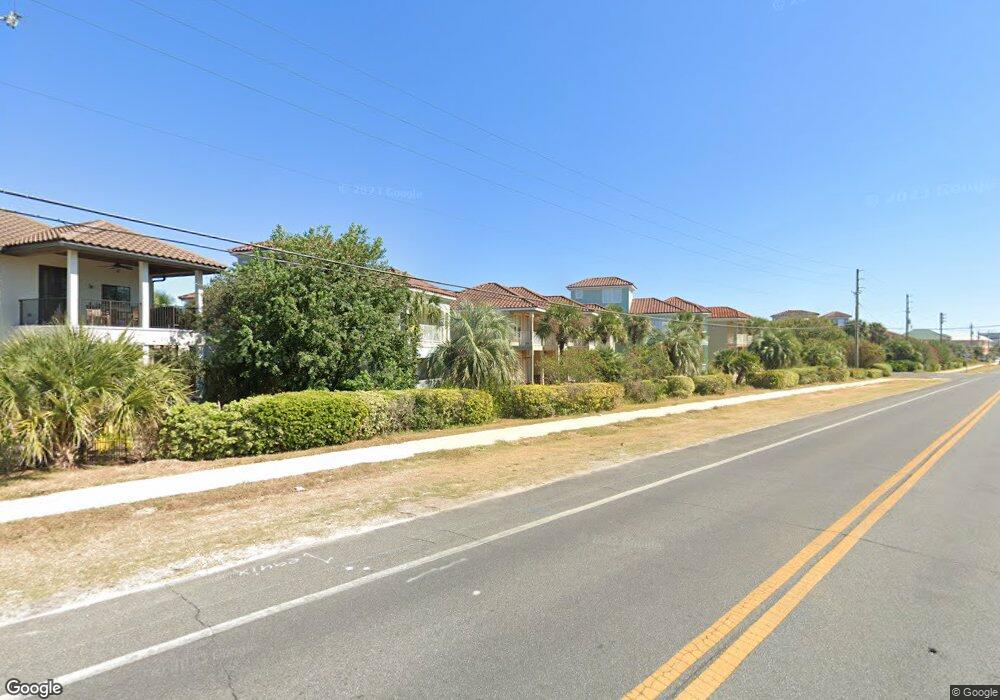
111 La Valencia Cir Panama City Beach, FL 32413
Estimated Value: $705,000 - $812,000
2
Beds
3
Baths
1,448
Sq Ft
$520/Sq Ft
Est. Value
About This Home
This home is located at 111 La Valencia Cir, Panama City Beach, FL 32413 and is currently estimated at $752,615, approximately $519 per square foot. 111 La Valencia Cir is a home located in Bay County with nearby schools including Surfside Middle School, J.R. Arnold High School, and West Bay Elementary School.
Ownership History
Date
Name
Owned For
Owner Type
Purchase Details
Closed on
Jun 25, 2019
Sold by
Pittman Dan M
Bought by
Lowrance Christopher J and Lowrance Bahar
Current Estimated Value
Home Financials for this Owner
Home Financials are based on the most recent Mortgage that was taken out on this home.
Original Mortgage
$310,000
Outstanding Balance
$272,585
Interest Rate
4%
Mortgage Type
New Conventional
Estimated Equity
$480,030
Purchase Details
Closed on
Jul 20, 2007
Sold by
Crem Co Llc
Bought by
Pittman Dan M
Purchase Details
Closed on
Jun 17, 2004
Sold by
Allinder Donald R and Allinder Joan M
Bought by
Crem Co Llc
Home Financials for this Owner
Home Financials are based on the most recent Mortgage that was taken out on this home.
Original Mortgage
$392,157
Interest Rate
6.3%
Mortgage Type
Unknown
Purchase Details
Closed on
Mar 23, 2001
Sold by
La Valencia Beach Resort Developers Inc
Bought by
Allinder Donald R and Allinder Joan M
Create a Home Valuation Report for This Property
The Home Valuation Report is an in-depth analysis detailing your home's value as well as a comparison with similar homes in the area
Home Values in the Area
Average Home Value in this Area
Purchase History
| Date | Buyer | Sale Price | Title Company |
|---|---|---|---|
| Lowrance Christopher J | $387,500 | Mcneese Title Llc | |
| Pittman Dan M | $390,000 | Attorney | |
| Crem Co Llc | $450,000 | Diamond Title Agency Inc | |
| Allinder Donald R | $89,300 | -- |
Source: Public Records
Mortgage History
| Date | Status | Borrower | Loan Amount |
|---|---|---|---|
| Open | Lowrance Christopher J | $310,000 | |
| Previous Owner | Crem Co Llc | $392,157 |
Source: Public Records
Tax History Compared to Growth
Tax History
| Year | Tax Paid | Tax Assessment Tax Assessment Total Assessment is a certain percentage of the fair market value that is determined by local assessors to be the total taxable value of land and additions on the property. | Land | Improvement |
|---|---|---|---|---|
| 2024 | $5,442 | $422,907 | -- | -- |
| 2023 | $5,442 | $384,461 | $118,291 | $374,763 |
| 2022 | $4,354 | $349,510 | $0 | $0 |
| 2021 | $3,850 | $317,736 | $90,862 | $226,874 |
| 2020 | $3,915 | $318,491 | $81,532 | $236,959 |
| 2019 | $3,580 | $287,287 | $70,765 | $216,522 |
| 2018 | $3,550 | $280,436 | $0 | $0 |
| 2017 | $3,385 | $265,385 | $0 | $0 |
| 2016 | $3,412 | $257,039 | $0 | $0 |
| 2015 | $3,124 | $233,672 | $0 | $0 |
| 2014 | $3,214 | $240,808 | $0 | $0 |
Source: Public Records
Map
Nearby Homes
- 21806 Webb St
- 416 La Valencia Cir
- 144 Dupree St
- 235 La Valencia Cir
- 413 La Valencia Cir
- 415 La Valencia Cir
- 21525 Hilltop Ave
- 21611 Front Beach Rd
- 21524 Front Beach Rd
- 21518 Front Beach Rd
- 21924 Front Beach Rd
- 21916 Belgrade Ave
- 21514 Front Beach Rd
- 104 Derondo St
- 21706 Palm Ave
- 21506 Dolphin Ave
- 112 Riviera Dr
- 116 Riviera Dr
- 22015 Front Beach Rd
- 21927 Bataan Ave
- 109 La Valencia Cir
- 113 La Valencia Cir
- 105 La Valencia Cir
- 0000 La Valencia Cir
- 117 La Valencia Cir
- 103 La Valencia Cir
- 138 La Valencia Cir
- 101 La Valencia Cir
- 120 La Valencia Cir
- 00 Le Grand Dr
- 21718 Front Beach Rd
- 21718 Front Beach Rd
- XXXX Valencia Av& Red Rd
- 334 La Valencia Cir
- 238 La Valencia Cir
- 121 La Valencia Cir
- 0 La Valencia Cir Unit 5 127959
- 0 La Valencia Cir
- 00 La Valencia Cir
- 00 La Valencia Cir Unit ''B''