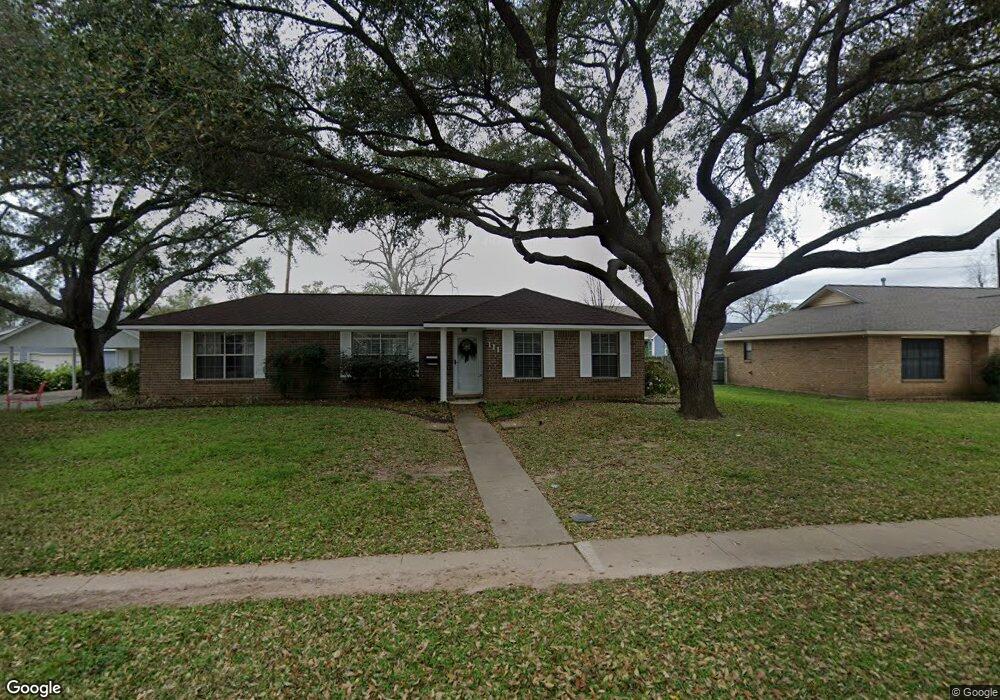
111 Lakeview Dr Sugar Land, TX 77498
Sugar Creek NeighborhoodEstimated Value: $322,000 - $463,000
2
Beds
2
Baths
1,286
Sq Ft
$300/Sq Ft
Est. Value
About This Home
This home is located at 111 Lakeview Dr, Sugar Land, TX 77498 and is currently estimated at $385,163, approximately $299 per square foot. 111 Lakeview Dr is a home located in Fort Bend County with nearby schools including Lakeview Elementary School, Sugar Land Middle School, and Kempner High School.
Ownership History
Date
Name
Owned For
Owner Type
Purchase Details
Closed on
Dec 31, 1996
Sold by
Chernosky James V
Bought by
Parmer Dennis and Parmer Becky
Current Estimated Value
Home Financials for this Owner
Home Financials are based on the most recent Mortgage that was taken out on this home.
Original Mortgage
$64,000
Interest Rate
7.54%
Mortgage Type
Seller Take Back
Create a Home Valuation Report for This Property
The Home Valuation Report is an in-depth analysis detailing your home's value as well as a comparison with similar homes in the area
Home Values in the Area
Average Home Value in this Area
Purchase History
| Date | Buyer | Sale Price | Title Company |
|---|---|---|---|
| Parmer Dennis | -- | Commonwealth Land Title Co |
Source: Public Records
Mortgage History
| Date | Status | Borrower | Loan Amount |
|---|---|---|---|
| Closed | Parmer Dennis | $64,000 |
Source: Public Records
Tax History Compared to Growth
Tax History
| Year | Tax Paid | Tax Assessment Tax Assessment Total Assessment is a certain percentage of the fair market value that is determined by local assessors to be the total taxable value of land and additions on the property. | Land | Improvement |
|---|---|---|---|---|
| 2025 | $7,375 | $412,619 | $276,920 | $135,699 |
| 2024 | $7,375 | $418,525 | $276,920 | $141,605 |
| 2023 | $7,526 | $423,280 | $276,920 | $146,360 |
| 2022 | $3,973 | $205,620 | $59,120 | $146,500 |
| 2021 | $3,435 | $170,970 | $59,120 | $111,850 |
| 2020 | $4,146 | $204,250 | $59,120 | $145,130 |
| 2019 | $4,383 | $208,540 | $59,120 | $149,420 |
| 2018 | $4,349 | $206,440 | $59,120 | $147,320 |
| 2017 | $4,270 | $200,460 | $59,120 | $141,340 |
| 2016 | $4,279 | $200,880 | $59,120 | $141,760 |
| 2015 | $3,663 | $192,240 | $59,120 | $133,120 |
| 2014 | $3,663 | $170,310 | $59,120 | $111,190 |
Source: Public Records
Map
Nearby Homes
- 102 4th St
- 414 Main St
- 702 E Park St
- 607 E Church Dr
- 227 Lakeview Dr
- 11206 Beverley Park St
- 231 Lakeview Dr
- 719 Burney Rd
- 106 Avenue G
- 110 Shadow Wood Dr
- 414 Lakeview Dr
- 934 Poydras St
- 210 Mill Trail Dr
- 115 Capri St
- 310 Brook Forest Trail
- 611 Lakeview Dr
- 730 Imperial Blvd
- 8230 Falling Water Ct
- 734 Imperial Blvd
- 102 Stadium Dr