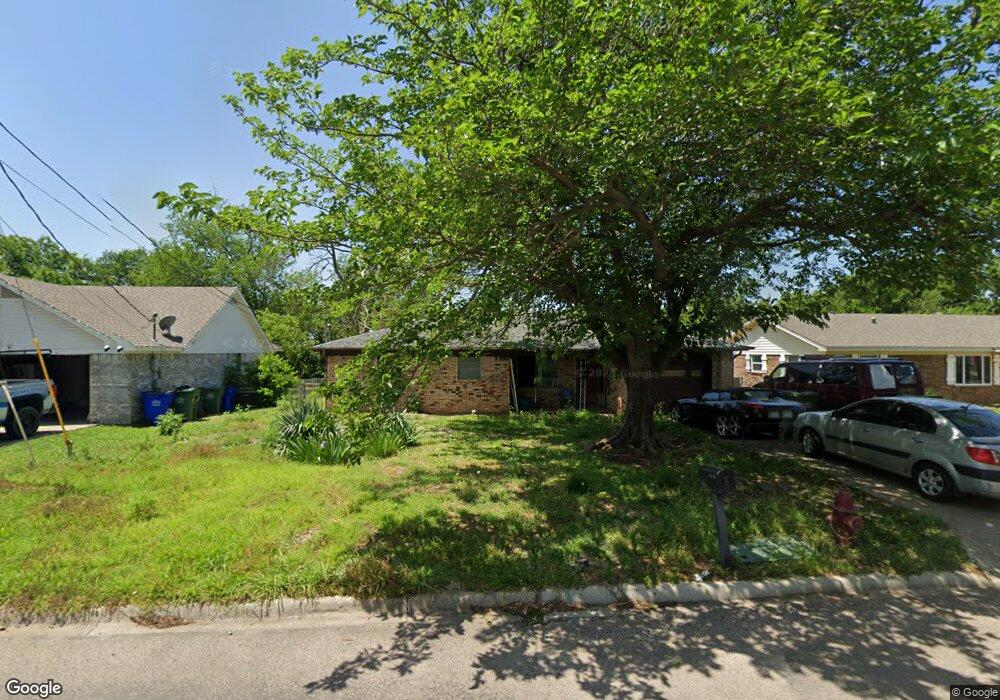
111 N Jordan St Whitesboro, TX 76273
Estimated Value: $165,512 - $182,000
--
Bed
--
Bath
1,011
Sq Ft
$172/Sq Ft
Est. Value
About This Home
This home is located at 111 N Jordan St, Whitesboro, TX 76273 and is currently estimated at $173,756, approximately $171 per square foot. 111 N Jordan St is a home located in Grayson County with nearby schools including J.W. Hayes Primary School, Whitesboro Intermediate School, and Whitesboro Middle School.
Ownership History
Date
Name
Owned For
Owner Type
Purchase Details
Closed on
Apr 20, 2020
Sold by
Clay Kay D and Estate Of Bobby Wayne Clay
Bought by
Paul Zane A and Medina Elizabeth
Current Estimated Value
Home Financials for this Owner
Home Financials are based on the most recent Mortgage that was taken out on this home.
Original Mortgage
$75,000
Outstanding Balance
$66,187
Interest Rate
3.2%
Mortgage Type
New Conventional
Estimated Equity
$107,569
Purchase Details
Closed on
Apr 1, 2005
Sold by
Estate Of Reona D Cumbie
Bought by
Clay Bobby and Clay Kay D
Create a Home Valuation Report for This Property
The Home Valuation Report is an in-depth analysis detailing your home's value as well as a comparison with similar homes in the area
Home Values in the Area
Average Home Value in this Area
Purchase History
| Date | Buyer | Sale Price | Title Company |
|---|---|---|---|
| Paul Zane A | -- | None Available | |
| Clay Bobby | -- | -- |
Source: Public Records
Mortgage History
| Date | Status | Borrower | Loan Amount |
|---|---|---|---|
| Open | Paul Zane A | $75,000 |
Source: Public Records
Tax History Compared to Growth
Tax History
| Year | Tax Paid | Tax Assessment Tax Assessment Total Assessment is a certain percentage of the fair market value that is determined by local assessors to be the total taxable value of land and additions on the property. | Land | Improvement |
|---|---|---|---|---|
| 2025 | $973 | $120,105 | $41,208 | $78,897 |
| 2024 | $2,176 | $110,437 | $0 | $0 |
| 2023 | $791 | $100,397 | $0 | $0 |
| 2022 | $2,054 | $104,238 | $43,166 | $61,072 |
| 2021 | $1,779 | $82,973 | $28,070 | $54,903 |
| 2020 | $1,852 | $82,944 | $23,909 | $59,035 |
| 2019 | $1,919 | $81,748 | $13,546 | $68,202 |
| 2018 | $1,671 | $69,848 | $13,546 | $56,302 |
| 2017 | $1,545 | $63,838 | $13,464 | $50,374 |
| 2016 | $1,331 | $55,000 | $7,752 | $47,248 |
| 2015 | $1,170 | $47,723 | $7,752 | $39,971 |
| 2014 | $1,221 | $49,797 | $7,752 | $42,045 |
Source: Public Records
Map
Nearby Homes