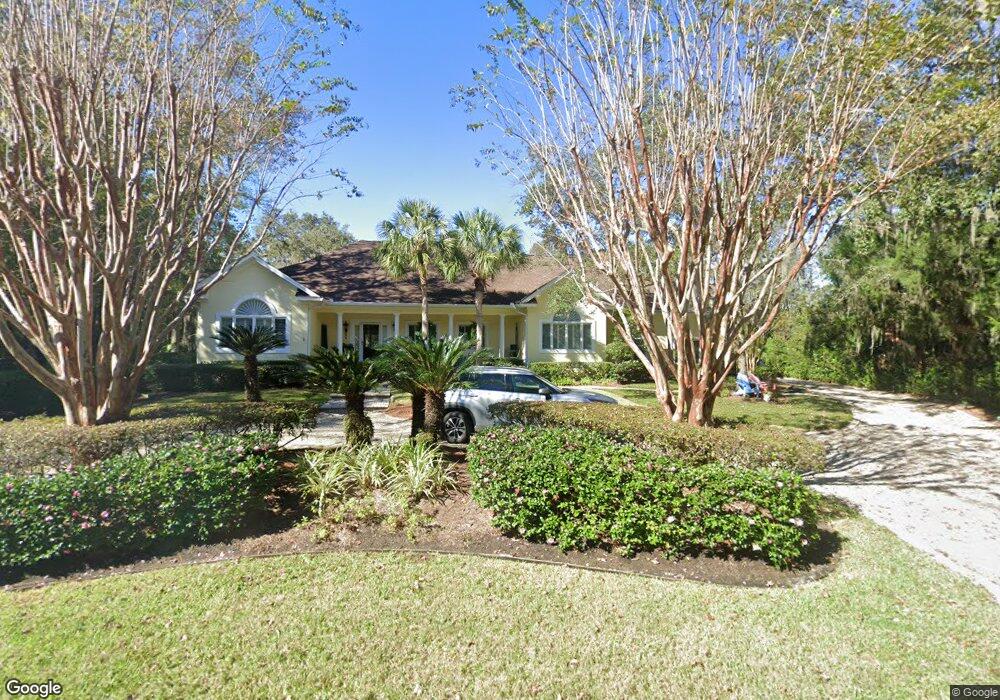
111 Shore Rush Cir Saint Simons Island, GA 31522
Estimated Value: $1,142,030 - $1,317,000
4
Beds
5
Baths
3,481
Sq Ft
$354/Sq Ft
Est. Value
About This Home
This home is located at 111 Shore Rush Cir, Saint Simons Island, GA 31522 and is currently estimated at $1,231,258, approximately $353 per square foot. 111 Shore Rush Cir is a home located in Glynn County with nearby schools including Oglethorpe Point Elementary School, Glynn Middle School, and Glynn Academy.
Ownership History
Date
Name
Owned For
Owner Type
Purchase Details
Closed on
May 4, 2005
Sold by
Fishman Richard A
Bought by
Fishman Richard A and Fishman Jacquelyn F
Current Estimated Value
Home Financials for this Owner
Home Financials are based on the most recent Mortgage that was taken out on this home.
Original Mortgage
$544,000
Outstanding Balance
$277,988
Interest Rate
5.63%
Mortgage Type
New Conventional
Estimated Equity
$953,270
Create a Home Valuation Report for This Property
The Home Valuation Report is an in-depth analysis detailing your home's value as well as a comparison with similar homes in the area
Home Values in the Area
Average Home Value in this Area
Purchase History
| Date | Buyer | Sale Price | Title Company |
|---|---|---|---|
| Fishman Richard A | -- | -- | |
| Fishman Richard A | $680,000 | -- |
Source: Public Records
Mortgage History
| Date | Status | Borrower | Loan Amount |
|---|---|---|---|
| Open | Fishman Richard A | $544,000 | |
| Closed | Fishman Richard A | $68,000 |
Source: Public Records
Tax History Compared to Growth
Tax History
| Year | Tax Paid | Tax Assessment Tax Assessment Total Assessment is a certain percentage of the fair market value that is determined by local assessors to be the total taxable value of land and additions on the property. | Land | Improvement |
|---|---|---|---|---|
| 2025 | $10,434 | $416,040 | $57,200 | $358,840 |
| 2024 | $10,484 | $418,040 | $57,200 | $360,840 |
| 2023 | $1,912 | $418,040 | $57,200 | $360,840 |
| 2022 | $2,071 | $290,360 | $46,800 | $243,560 |
| 2021 | $2,128 | $286,560 | $46,800 | $239,760 |
| 2020 | $2,179 | $268,800 | $46,800 | $222,000 |
| 2019 | $2,179 | $268,800 | $46,800 | $222,000 |
| 2018 | $2,444 | $268,800 | $46,800 | $222,000 |
| 2017 | $6,468 | $268,800 | $46,800 | $222,000 |
| 2016 | $5,976 | $251,040 | $46,800 | $204,240 |
| 2015 | $5,533 | $224,400 | $46,800 | $177,600 |
| 2014 | $5,533 | $224,400 | $46,800 | $177,600 |
Source: Public Records
Map
Nearby Homes
- 121 Shore Rush Dr
- 122 Shore Rush Dr
- 121 Colonial Dr
- 157 Shore Rush Dr
- 123 Maple St
- 228 Sea Palms Colony Unit 228C
- 406 Palm Dr
- 287 Cedar St
- 259 Moss Oak Ln
- 274 Moss Oak Ln
- 257 Moss Oak Ln
- 280 Moss Oak Ln
- 318 Palm St
- 405 Magnolia St
- 315 Pine St
- 18 Country Club Ct
- 420 Holly St
- 423 Palmetto St
- 311 Dunbarton Dr
- 112 Rosemont St
- 109 Shore Rush Cir
- 112 Shore Rush Cir
- 110 Shore Rush Cir
- 115 Shore Rush Cir
- 107 Shore Rush Cir
- 116 Shore Rush Cir
- 0 Shore Rush Cir Unit 15610
- 108 Shore Rush Cir
- 117 Shore Rush Cir
- 115 Bayberry
- 115 Bay Berry Cir
- 129 Shore Rush Dr
- 127 Shore Rush Dr
- 120 Shore Rush Cir
- 105 Shore Rush Cir
- 106 Shore Rush Cir
- 117 Bayberry Cir
- 117 Bay Berry Cir
- 110 Great Oak Place
- 125 Shore Rush Dr