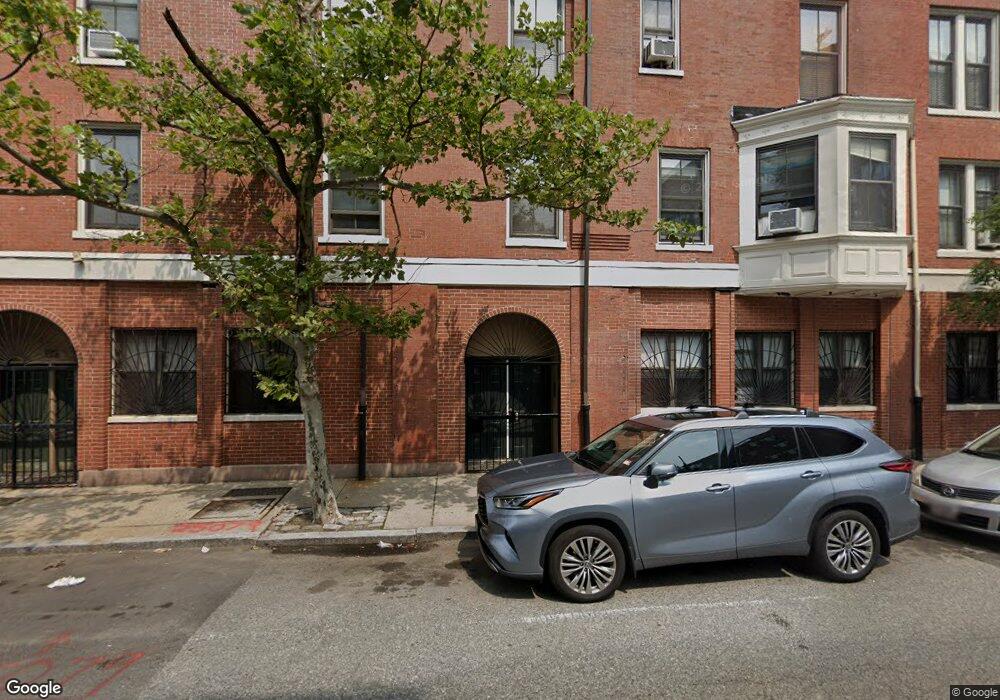
111 W Dedham St Boston, MA 02118
South End NeighborhoodEstimated Value: $1,212,000 - $1,728,000
2
Beds
2
Baths
1,522
Sq Ft
$924/Sq Ft
Est. Value
About This Home
This home is located at 111 W Dedham St, Boston, MA 02118 and is currently estimated at $1,405,887, approximately $923 per square foot. 111 W Dedham St is a home located in Suffolk County with nearby schools including Bridge Boston Charter School, Edward M. Kennedy Academy for Health Careers, and Torit Montessori School.
Ownership History
Date
Name
Owned For
Owner Type
Purchase Details
Closed on
Mar 12, 2013
Sold by
Mynahan Neal G
Bought by
R & R Capitol Inv Llc
Current Estimated Value
Home Financials for this Owner
Home Financials are based on the most recent Mortgage that was taken out on this home.
Original Mortgage
$456,000
Outstanding Balance
$320,472
Interest Rate
3.45%
Mortgage Type
New Conventional
Estimated Equity
$1,085,415
Create a Home Valuation Report for This Property
The Home Valuation Report is an in-depth analysis detailing your home's value as well as a comparison with similar homes in the area
Home Values in the Area
Average Home Value in this Area
Purchase History
| Date | Buyer | Sale Price | Title Company |
|---|---|---|---|
| R & R Capitol Inv Llc | $575,000 | -- |
Source: Public Records
Mortgage History
| Date | Status | Borrower | Loan Amount |
|---|---|---|---|
| Open | R & R Capitol Inv Llc | $456,000 |
Source: Public Records
Tax History Compared to Growth
Tax History
| Year | Tax Paid | Tax Assessment Tax Assessment Total Assessment is a certain percentage of the fair market value that is determined by local assessors to be the total taxable value of land and additions on the property. | Land | Improvement |
|---|---|---|---|---|
| 2025 | $12,007 | $1,036,900 | $0 | $1,036,900 |
| 2024 | $11,045 | $1,013,300 | $0 | $1,013,300 |
| 2023 | $10,666 | $993,100 | $0 | $993,100 |
| 2022 | $10,699 | $983,400 | $0 | $983,400 |
| 2021 | $10,287 | $964,100 | $0 | $964,100 |
| 2020 | $10,346 | $979,700 | $0 | $979,700 |
| 2019 | $10,022 | $950,900 | $0 | $950,900 |
| 2018 | $9,397 | $896,700 | $0 | $896,700 |
| 2017 | $9,044 | $854,000 | $0 | $854,000 |
| 2016 | $9,033 | $821,200 | $0 | $821,200 |
| 2015 | $8,553 | $706,300 | $0 | $706,300 |
| 2014 | $8,064 | $641,000 | $0 | $641,000 |
Source: Public Records
Map
Nearby Homes
- 596 Tremont St Unit 2
- 30 Dartmouth St Unit 3
- 33 Union Park Unit 4
- 377 Shawmut Ave
- 379 Shawmut Ave
- 320 Shawmut Ave Unit 4
- 667 Tremont St Unit 3
- 667 Tremont St Unit 1
- 667 Tremont St Unit 4
- 85 Pembroke St Unit 2
- 6 Dartmouth Place Unit 6
- 32 Hanson St Unit 2
- 87 Pembroke St
- 93 Pembroke St Unit 1
- 668 Tremont St Unit 3
- 57 Warren Ave Unit 3
- 36 Milford St Unit 1
- 1395 Washington St Unit PH3
- 1395 Washington St Unit 306
- 1395 Washington St Unit 501
- 111 W Dedham St Unit 608 Tremont 4
- 115 W Dedham St
- 608 Tremont St Unit 2
- 606 Tremont St Unit 8
- 606 Tremont St Unit 7
- 606 Tremont St Unit 6
- 606 Tremont St Unit 5
- 606 Tremont St Unit 1
- 113 W Dedham St
- 608 Tremont St Unit 5
- 113 W Dedham St Unit 2
- 113 W Dedham St
- 608 Tremont St Unit 4
- 113 W Dedham St Unit 113
- 608 Tremont St Unit 1
- 608 Tremont St Unit 7
- 608 Tremont St Unit 8
- 608 Tremont St Unit 6
- 604 Tremont St Unit 4
- 604 Tremont St Unit 3