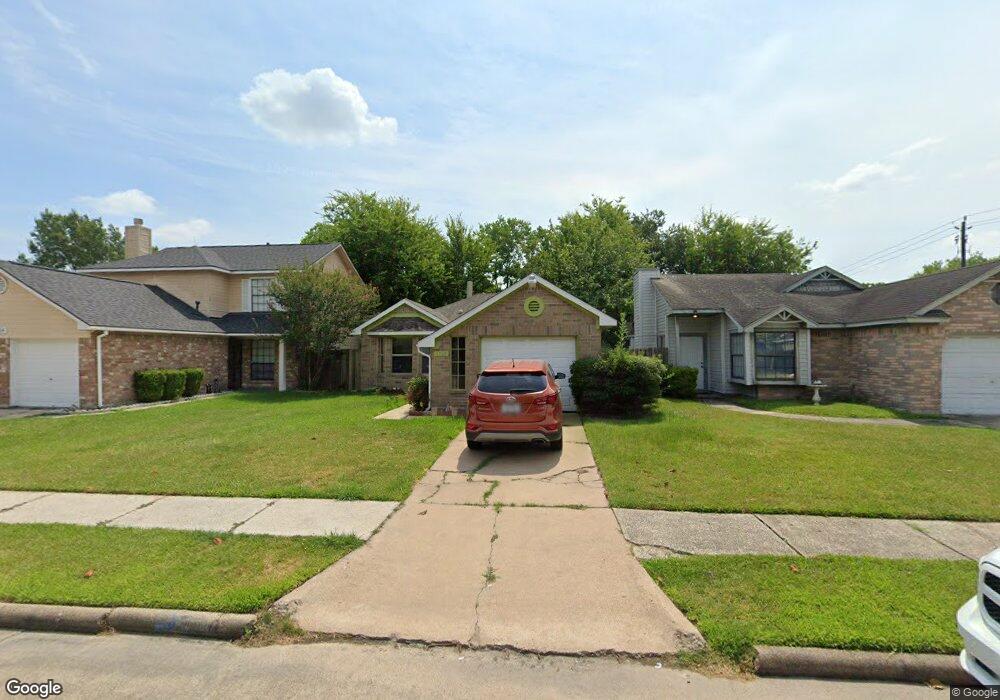
1110 Holbech Ln Channelview, TX 77530
Estimated Value: $171,132 - $179,000
2
Beds
2
Baths
1,008
Sq Ft
$175/Sq Ft
Est. Value
About This Home
This home is located at 1110 Holbech Ln, Channelview, TX 77530 and is currently estimated at $176,033, approximately $174 per square foot. 1110 Holbech Ln is a home located in Harris County with nearby schools including Channelview High School, Family Christian Academy, and Creative Corner.
Ownership History
Date
Name
Owned For
Owner Type
Purchase Details
Closed on
Jun 13, 2017
Sold by
Ventures Trust 2013
Bought by
Stuart Charmaine
Current Estimated Value
Home Financials for this Owner
Home Financials are based on the most recent Mortgage that was taken out on this home.
Original Mortgage
$99,562
Outstanding Balance
$83,404
Interest Rate
4.37%
Mortgage Type
FHA
Estimated Equity
$92,629
Purchase Details
Closed on
Feb 7, 2017
Sold by
Seth Kenneth B
Bought by
Ventures Trust and Mcm Capital Partners Lllp
Purchase Details
Closed on
Jan 19, 1996
Sold by
Willburn Robert and Willburn Twana
Bought by
Seth Kenneth B
Home Financials for this Owner
Home Financials are based on the most recent Mortgage that was taken out on this home.
Original Mortgage
$48,858
Interest Rate
8%
Mortgage Type
VA
Create a Home Valuation Report for This Property
The Home Valuation Report is an in-depth analysis detailing your home's value as well as a comparison with similar homes in the area
Home Values in the Area
Average Home Value in this Area
Purchase History
| Date | Buyer | Sale Price | Title Company |
|---|---|---|---|
| Stuart Charmaine | -- | None Available | |
| Ventures Trust | -- | None Available | |
| Seth Kenneth B | -- | -- |
Source: Public Records
Mortgage History
| Date | Status | Borrower | Loan Amount |
|---|---|---|---|
| Open | Stuart Charmaine | $99,562 | |
| Previous Owner | Seth Kenneth B | $48,858 |
Source: Public Records
Tax History Compared to Growth
Tax History
| Year | Tax Paid | Tax Assessment Tax Assessment Total Assessment is a certain percentage of the fair market value that is determined by local assessors to be the total taxable value of land and additions on the property. | Land | Improvement |
|---|---|---|---|---|
| 2025 | $307 | $137,354 | $32,924 | $104,430 |
| 2024 | $307 | $133,909 | $32,924 | $100,985 |
| 2023 | $307 | $142,809 | $32,924 | $109,885 |
| 2022 | $2,921 | $127,905 | $32,924 | $94,981 |
| 2021 | $2,813 | $114,217 | $32,924 | $81,293 |
| 2020 | $2,795 | $101,553 | $29,851 | $71,702 |
| 2019 | $2,876 | $100,532 | $29,851 | $70,681 |
| 2018 | $1,367 | $97,947 | $29,851 | $68,096 |
| 2017 | $2,557 | $87,467 | $21,949 | $65,518 |
| 2016 | $2,245 | $76,794 | $17,559 | $59,235 |
| 2015 | $1,904 | $67,417 | $12,072 | $55,345 |
| 2014 | $1,904 | $60,865 | $12,072 | $48,793 |
Source: Public Records
Map
Nearby Homes
- 1123 Maclesby Ln
- 1102 Heathfield Dr
- 909 Pennygent Ln
- 1034 Littleport Ln
- 14951 Scotter Dr
- 1323 Padstow Ln
- 1343 Littleport Ln
- 14918 Silver Green Dr S
- 15122 Sheffield Terrace
- 1330 Stevenage Ln
- 14835 Scotter Dr
- 827 Dondell St
- 1315 Goswell Ln
- 1130 Fairlane Square
- 814 Deercrest St
- 727 Doncrest St
- 1303 Sterling Green Ct
- 830 Stonyridge St
- 730 Doncrest St
- 14806 Beaconsfield Dr
- 1114 Holbech Ln
- 1106 Holbech Ln
- 1118 Holbech Ln
- 1102 Holbech Ln
- 1111 Littleport Ln
- 1115 Littleport Ln
- 1107 Littleport Ln
- 1122 Holbech Ln
- 1119 Littleport Ln
- 1103 Littleport Ln
- 1111 Holbech Ln
- 1103 Holbech Ln
- 1123 Littleport Ln
- 1115 Holbech Ln
- 1126 Holbech Ln
- 1119 Holbech Ln
- 1127 Littleport Ln
- 1054 Holbech Ln
- 1130 Holbech Ln
- 1127 Holbech Ln