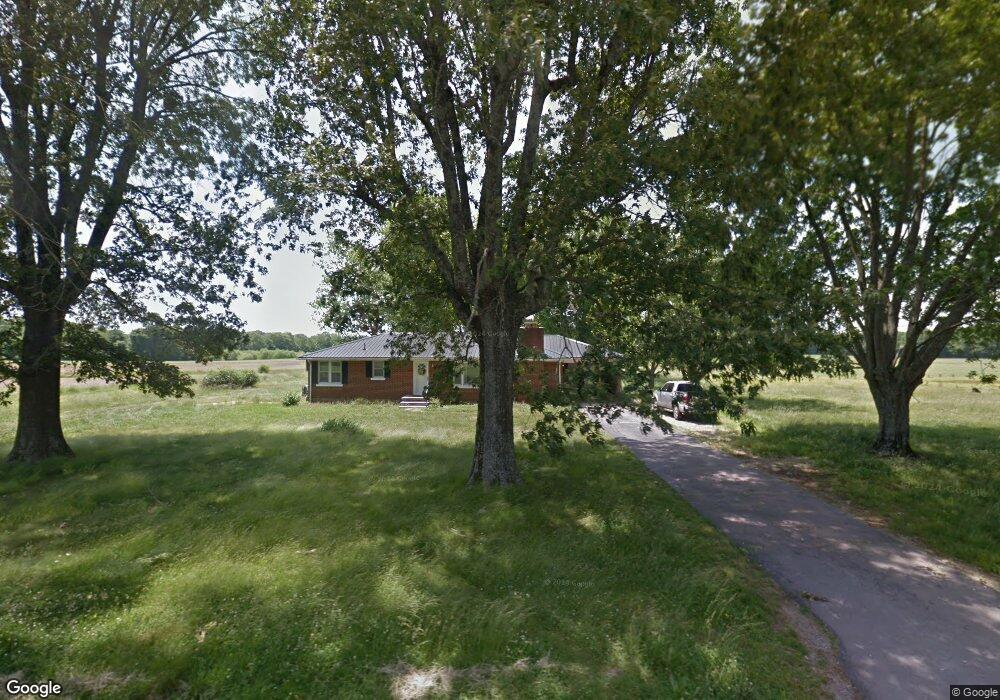
1110 Mattoxtown Rd Lawrenceburg, TN 38464
Estimated Value: $224,000 - $259,000
--
Bed
1
Bath
1,350
Sq Ft
$182/Sq Ft
Est. Value
About This Home
This home is located at 1110 Mattoxtown Rd, Lawrenceburg, TN 38464 and is currently estimated at $246,319, approximately $182 per square foot. 1110 Mattoxtown Rd is a home located in Lawrence County with nearby schools including Ingram Sowell Elementary School, Ethridge Elementary School, and Lawrenceburg Public Elementary School.
Ownership History
Date
Name
Owned For
Owner Type
Purchase Details
Closed on
Nov 25, 2019
Sold by
Clanton Rex and Clanton Susan
Bought by
Jones Deborah
Current Estimated Value
Home Financials for this Owner
Home Financials are based on the most recent Mortgage that was taken out on this home.
Original Mortgage
$105,300
Outstanding Balance
$92,451
Interest Rate
3.5%
Estimated Equity
$153,868
Purchase Details
Closed on
Apr 16, 2019
Sold by
Faulkner Stanley and Chandler Sheila
Bought by
Clanton Rex and Clanton Susan
Purchase Details
Closed on
Apr 16, 2015
Sold by
Newton Gary Roger
Bought by
Faulkner Herbert and Faulkner Evelyn
Purchase Details
Closed on
Dec 26, 2003
Bought by
Newton Gary Roger and Newton Virginia Gregg
Purchase Details
Closed on
Dec 6, 1994
Sold by
Newton W R
Bought by
Steven Inman
Purchase Details
Closed on
Sep 3, 1959
Bought by
Newton W R
Purchase Details
Closed on
Dec 14, 1953
Create a Home Valuation Report for This Property
The Home Valuation Report is an in-depth analysis detailing your home's value as well as a comparison with similar homes in the area
Home Values in the Area
Average Home Value in this Area
Purchase History
| Date | Buyer | Sale Price | Title Company |
|---|---|---|---|
| Jones Deborah | $117,000 | Compass Land Title | |
| Clanton Rex | $50,670 | None Available | |
| Faulkner Herbert | $65,000 | -- | |
| Faulkner Gaylon | $265,000 | -- | |
| Newton Gary Roger | -- | -- | |
| Steven Inman | $75,000 | -- | |
| Newton W R | -- | -- | |
| -- | -- | -- |
Source: Public Records
Mortgage History
| Date | Status | Borrower | Loan Amount |
|---|---|---|---|
| Open | Jones Deborah | $105,300 |
Source: Public Records
Tax History Compared to Growth
Tax History
| Year | Tax Paid | Tax Assessment Tax Assessment Total Assessment is a certain percentage of the fair market value that is determined by local assessors to be the total taxable value of land and additions on the property. | Land | Improvement |
|---|---|---|---|---|
| 2025 | $852 | $42,400 | $0 | $0 |
| 2024 | $852 | $42,400 | $3,600 | $38,800 |
| 2023 | $852 | $42,400 | $3,600 | $38,800 |
| 2022 | $852 | $42,400 | $3,600 | $38,800 |
| 2021 | $817 | $27,600 | $2,625 | $24,975 |
| 2020 | $817 | $27,600 | $2,625 | $24,975 |
| 2019 | $544 | $18,400 | $2,625 | $15,775 |
| 2018 | $544 | $18,400 | $2,625 | $15,775 |
| 2017 | $544 | $18,400 | $2,625 | $15,775 |
| 2016 | $544 | $18,400 | $2,625 | $15,775 |
| 2015 | $504 | $18,400 | $2,625 | $15,775 |
| 2014 | $1,152 | $42,075 | $26,400 | $15,675 |
Source: Public Records
Map
Nearby Homes
- 1088 Mattox Town Rd
- 1083 Mattox Town Rd
- 0 Lightfoot Ln
- 31 Community Rd
- 56 Mattox Rd
- 0 Good Hope Rd
- 729 Weakley Creek Rd
- 0 Woodland Cir Unit RTC3033314
- 48 Woodland Cir
- 2763 Highway 43 N
- 114 Hummingbird Ln
- 132 Sundance Dr
- 52 Beuerlein Cir
- 413 Kirk St
- 975 Weakley Creek Rd
- 4000 Weakley Creek Rd
- 4951 Weakley Creek Rd
- 14 Delana Ave
- 1050 Baylee Cir
- 23 Balee Dr
- 1110 Mattox Town Rd
- 1113 Mattoxtown Rd
- 1113 Mattox Town Rd
- 1109 Mattox Town Rd
- 1116 Mattox Town Rd
- 1122 Mattox Town Rd
- 1094 Mattox Town Rd
- 1093 Mattox Town Rd
- 0 Mattoxtown Rd N Unit RTC2197586
- 1090 Mattox Town Rd
- 1090 Mattox Town Rd
- 1091 Mattox Town Rd
- 1085 Mattox Town Rd
- 2475 Brandi Ln
- 2475 Brandi Ln
- 1140 Mattox Town Rd
- 1140 Mattoxtown Rd
- 0 Mattox Town Rd
- 2471 Brandi Ln
- 1083 Mattoxtown Rd