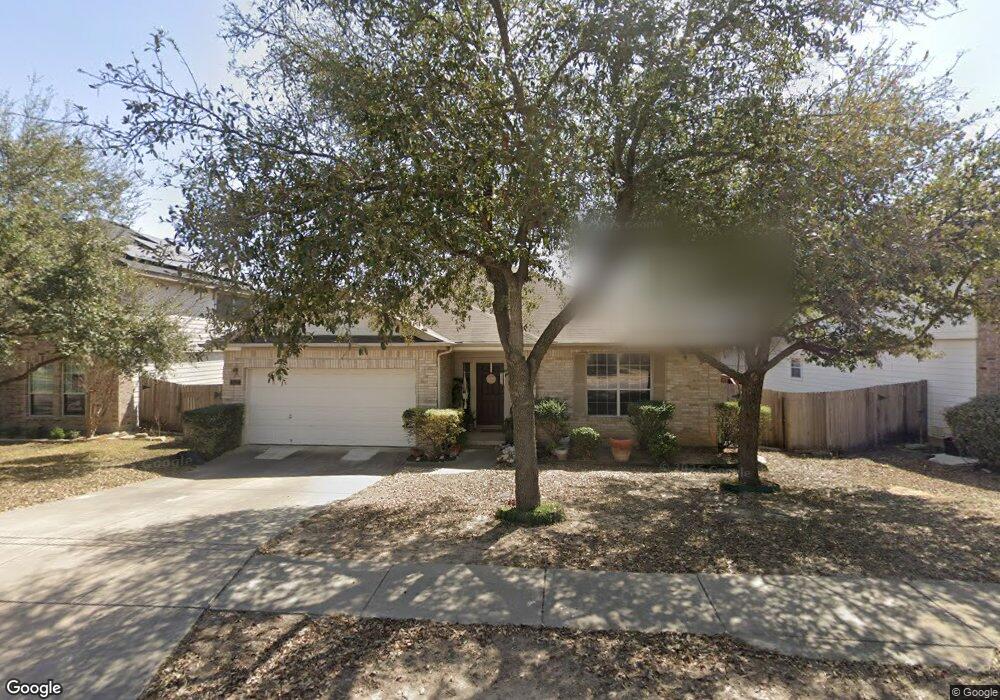
11110 Shetland Hills San Antonio, TX 78254
Estimated Value: $296,406 - $325,000
3
Beds
2
Baths
2,136
Sq Ft
$145/Sq Ft
Est. Value
About This Home
This home is located at 11110 Shetland Hills, San Antonio, TX 78254 and is currently estimated at $310,352, approximately $145 per square foot. 11110 Shetland Hills is a home located in Bexar County with nearby schools including Krueger Elementary School, Jefferson Middle School, and School of Science and Technology Hill Country.
Ownership History
Date
Name
Owned For
Owner Type
Purchase Details
Closed on
Oct 21, 2013
Sold by
Finley Aaron M and Finley Kristina
Bought by
Magana Moises and Magana Alicia
Current Estimated Value
Home Financials for this Owner
Home Financials are based on the most recent Mortgage that was taken out on this home.
Original Mortgage
$100,000
Outstanding Balance
$75,491
Interest Rate
4.62%
Mortgage Type
New Conventional
Estimated Equity
$234,861
Purchase Details
Closed on
Sep 4, 2007
Sold by
Continental Homes Of Texas Lp
Bought by
Finley Aaron M
Home Financials for this Owner
Home Financials are based on the most recent Mortgage that was taken out on this home.
Original Mortgage
$183,626
Interest Rate
6.63%
Mortgage Type
FHA
Create a Home Valuation Report for This Property
The Home Valuation Report is an in-depth analysis detailing your home's value as well as a comparison with similar homes in the area
Home Values in the Area
Average Home Value in this Area
Purchase History
| Date | Buyer | Sale Price | Title Company |
|---|---|---|---|
| Magana Moises | -- | None Available | |
| Finley Aaron M | -- | Dhi Title |
Source: Public Records
Mortgage History
| Date | Status | Borrower | Loan Amount |
|---|---|---|---|
| Open | Magana Moises | $100,000 | |
| Previous Owner | Finley Aaron M | $183,626 |
Source: Public Records
Tax History Compared to Growth
Tax History
| Year | Tax Paid | Tax Assessment Tax Assessment Total Assessment is a certain percentage of the fair market value that is determined by local assessors to be the total taxable value of land and additions on the property. | Land | Improvement |
|---|---|---|---|---|
| 2025 | $4,093 | $279,000 | $60,020 | $218,980 |
| 2024 | $4,093 | $294,000 | $60,020 | $233,980 |
| 2023 | $4,093 | $272,250 | $60,020 | $239,980 |
| 2022 | $5,027 | $247,500 | $50,040 | $234,960 |
| 2021 | $4,863 | $231,000 | $45,510 | $197,460 |
| 2020 | $4,516 | $210,000 | $45,510 | $164,490 |
| 2019 | $4,763 | $214,500 | $34,980 | $180,020 |
| 2018 | $4,333 | $195,000 | $34,980 | $160,020 |
| 2017 | $4,545 | $204,100 | $34,980 | $169,120 |
| 2016 | $4,417 | $198,330 | $34,980 | $163,350 |
| 2015 | $3,959 | $188,430 | $34,980 | $153,450 |
| 2014 | $3,959 | $176,760 | $0 | $0 |
Source: Public Records
Map
Nearby Homes
- 11019 Palomino Bend
- 10814 Shetland Hills
- 9714 Connemara Bend
- 10767 Pharaoh Run
- 9707 Mustang Bay
- 10706 Pharaoh Run
- 9726 Palomino Oaks
- 10707 Pharaoh Run
- 10707 Arabian Sands
- 10719 Serrento Hi
- 11463 Feather Vale
- 11420 Feather Vale
- 11451 Feather Vale
- 11459 Feather Vale
- 11452 Feather Vale Blank
- 11447 Feather Vale Blank
- 9510 Caspian Forest
- 11467 Feather Vale
- 10627 Arabian Sands
- 9807 Sandlet Trail
- 11114 Shetland Hills
- 11106 Shetland Hills
- 10030 Shetland Wind
- 11118 Shetland Hills
- 10026 Shetland Wind
- 11102 Shetland Hills
- 10034 Shetland Wind
- 10022 Shetland Wind
- 11111 Shetland Hills
- 11115 Shetland Hills
- 11103 Shetland Hills
- 11026 Shetland Hills
- 10038 Shetland Wind
- 11031 Mustang Spring
- 10027 Shetland Wind
- 11119 Shetland Hills
- 10019 Shetland Wind
- 11027 Mustang Springs
- 11022 Shetland Hills
- 10042 Shetland Wind