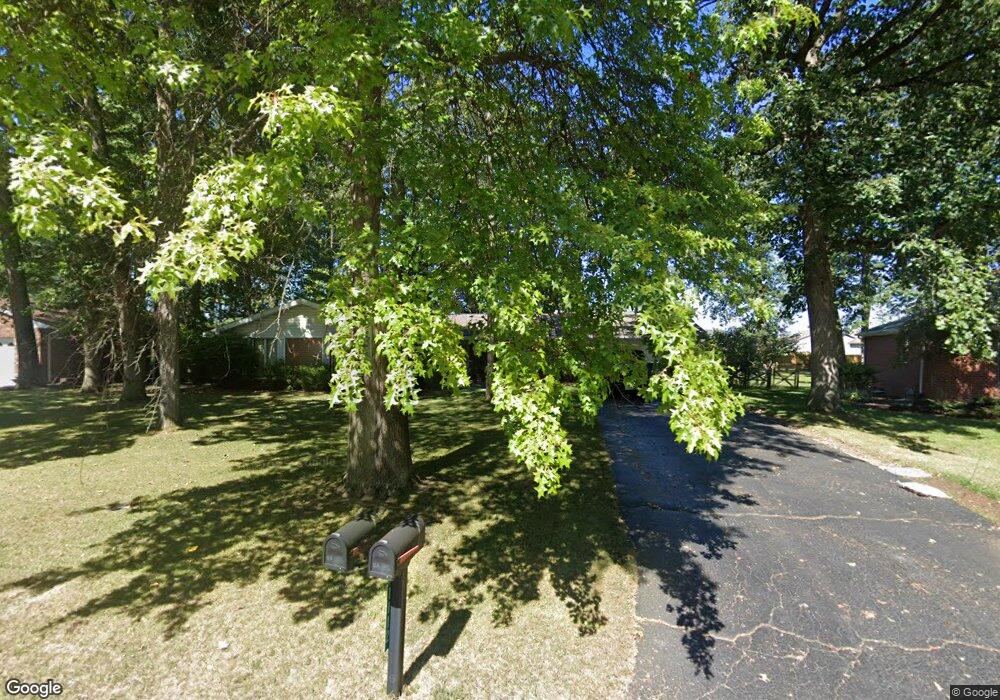
1112 Ironwood Dr Findlay, OH 45840
Estimated Value: $310,702 - $388,000
4
Beds
3
Baths
1,984
Sq Ft
$169/Sq Ft
Est. Value
About This Home
This home is located at 1112 Ironwood Dr, Findlay, OH 45840 and is currently estimated at $335,676, approximately $169 per square foot. 1112 Ironwood Dr is a home located in Hancock County with nearby schools including Liberty-Benton Elementary School, Liberty-Benton Middle School, and Liberty-Benton High School.
Ownership History
Date
Name
Owned For
Owner Type
Purchase Details
Closed on
Nov 15, 2021
Sold by
Iler Chris A and Iler Julie M
Bought by
Iler Christopher A and Iler Julie M
Current Estimated Value
Home Financials for this Owner
Home Financials are based on the most recent Mortgage that was taken out on this home.
Original Mortgage
$137,700
Outstanding Balance
$108,254
Interest Rate
3.05%
Mortgage Type
New Conventional
Estimated Equity
$227,422
Purchase Details
Closed on
Mar 14, 2002
Sold by
Winesett Sarah
Bought by
Iler Chris A
Home Financials for this Owner
Home Financials are based on the most recent Mortgage that was taken out on this home.
Original Mortgage
$156,000
Interest Rate
7.11%
Mortgage Type
Balloon
Purchase Details
Closed on
Aug 11, 1998
Sold by
Kovac James
Bought by
Winesett Sarah
Purchase Details
Closed on
Jul 25, 1983
Bought by
Kovac James S and Kovac Mary C
Create a Home Valuation Report for This Property
The Home Valuation Report is an in-depth analysis detailing your home's value as well as a comparison with similar homes in the area
Home Values in the Area
Average Home Value in this Area
Purchase History
| Date | Buyer | Sale Price | Title Company |
|---|---|---|---|
| Iler Christopher A | -- | Flag City Title Agency | |
| Iler Chris A | $195,000 | -- | |
| Winesett Sarah | $190,000 | -- | |
| Kovac James S | $87,000 | -- |
Source: Public Records
Mortgage History
| Date | Status | Borrower | Loan Amount |
|---|---|---|---|
| Open | Iler Christopher A | $137,700 | |
| Closed | Iler Chris A | $156,000 |
Source: Public Records
Tax History Compared to Growth
Tax History
| Year | Tax Paid | Tax Assessment Tax Assessment Total Assessment is a certain percentage of the fair market value that is determined by local assessors to be the total taxable value of land and additions on the property. | Land | Improvement |
|---|---|---|---|---|
| 2024 | $3,077 | $82,770 | $10,690 | $72,080 |
| 2023 | $3,004 | $82,770 | $10,690 | $72,080 |
| 2022 | $2,975 | $82,770 | $10,690 | $72,080 |
| 2021 | $2,738 | $67,240 | $10,710 | $56,530 |
| 2020 | $2,761 | $67,240 | $10,710 | $56,530 |
| 2019 | $2,649 | $67,240 | $10,710 | $56,530 |
| 2018 | $2,086 | $58,460 | $9,310 | $49,150 |
| 2017 | $1,076 | $58,460 | $9,310 | $49,150 |
| 2016 | $2,093 | $58,460 | $9,310 | $49,150 |
| 2015 | $2,334 | $63,750 | $9,310 | $54,440 |
| 2014 | $2,356 | $63,750 | $9,310 | $54,440 |
| 2012 | $2,461 | $63,750 | $9,310 | $54,440 |
Source: Public Records
Map
Nearby Homes
- 1310 Muirfield Dr
- 3018 Gleneagle Dr
- 3106 Saddlebrook
- 1405 Cypress Lake
- 3300 Crosshill Dr
- 933 Laurel Ln
- 615 Hillcrest Ave
- 0 Township Highway 99
- 12325 Township Highway 99
- 506 Hillcrest Ave
- 0 Allen Township 142
- 6535 Silver Lake Dr
- 0 Bushwillow Dr Or Rock Candy Rd Unit Lot 157
- 0 Rock Candy Rd Or Bushwillow Dr Unit Lot 173
- 0 Bearcat Way Or Rock Candy Rd Unit Lot 167
- 925 W Melrose Ave
- 905 W Melrose Ave
- 0 Rock Candy Rd Unit Lot 159
- 0 Rock Candy Rd Unit Lot 170
- 0 Rock Candy Rd Unit Lot 172 206819
- 1118 Ironwood Dr
- 1106 Ironwood Dr
- 1124 Ironwood Dr
- 3306 Gleneagle Dr
- 1041 White Birch Dr
- 3250 Gleneagle Dr
- 3308 Gleneagle Dr
- 1117 Ironwood Dr
- 3316 Gleneagle Dr
- 1130 Ironwood Dr
- 1047 White Birch Dr
- 1053 White Birch Dr
- 3324 Gleneagle Dr
- 3322 Gleneagle Dr Unit 1
- 3242 Gleneagle Dr
- 1050 White Birch Dr
- 1052 White Birch Dr
- 1035 White Birch Dr
- 1136 Ironwood Dr
- 3234 Gleneagle Dr