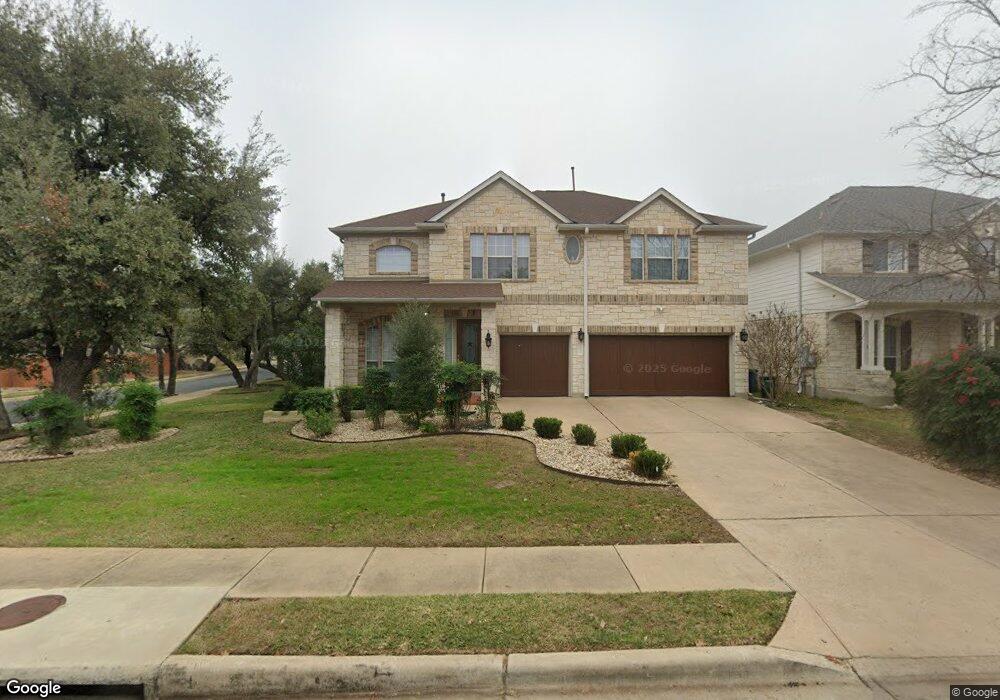
11123 Alison Park Trail Austin, TX 78750
Anderson Mill NeighborhoodEstimated Value: $808,812 - $835,000
4
Beds
4
Baths
3,522
Sq Ft
$233/Sq Ft
Est. Value
About This Home
This home is located at 11123 Alison Park Trail, Austin, TX 78750 and is currently estimated at $821,703, approximately $233 per square foot. 11123 Alison Park Trail is a home located in Williamson County with nearby schools including Purple Sage Elementary School, Noel Grisham Middle, and Westwood High School.
Ownership History
Date
Name
Owned For
Owner Type
Purchase Details
Closed on
Jan 28, 2011
Sold by
Finger Dana C and White Dana Colette
Bought by
Thotakura Lakshmi R and Thotakura Mangeswar R
Current Estimated Value
Home Financials for this Owner
Home Financials are based on the most recent Mortgage that was taken out on this home.
Original Mortgage
$323,000
Outstanding Balance
$221,650
Interest Rate
4.84%
Mortgage Type
New Conventional
Estimated Equity
$600,053
Purchase Details
Closed on
Oct 2, 2008
Sold by
Finger James W
Bought by
Finger Dana C
Home Financials for this Owner
Home Financials are based on the most recent Mortgage that was taken out on this home.
Original Mortgage
$309,854
Interest Rate
6.35%
Mortgage Type
Purchase Money Mortgage
Create a Home Valuation Report for This Property
The Home Valuation Report is an in-depth analysis detailing your home's value as well as a comparison with similar homes in the area
Home Values in the Area
Average Home Value in this Area
Purchase History
| Date | Buyer | Sale Price | Title Company |
|---|---|---|---|
| Thotakura Lakshmi R | -- | Independence Title Company | |
| Finger Dana C | -- | None Available |
Source: Public Records
Mortgage History
| Date | Status | Borrower | Loan Amount |
|---|---|---|---|
| Open | Thotakura Lakshmi R | $323,000 | |
| Previous Owner | Finger Dana C | $309,854 |
Source: Public Records
Tax History Compared to Growth
Tax History
| Year | Tax Paid | Tax Assessment Tax Assessment Total Assessment is a certain percentage of the fair market value that is determined by local assessors to be the total taxable value of land and additions on the property. | Land | Improvement |
|---|---|---|---|---|
| 2025 | $13,646 | $821,175 | $150,000 | $671,175 |
| 2024 | $13,646 | $722,401 | $150,000 | $572,401 |
| 2023 | $12,249 | $659,313 | $150,000 | $509,313 |
| 2022 | $16,612 | $823,567 | $138,000 | $685,567 |
| 2021 | $13,893 | $593,909 | $97,000 | $496,909 |
| 2020 | $11,359 | $502,290 | $90,383 | $411,907 |
| 2019 | $11,211 | $481,401 | $81,000 | $400,401 |
| 2018 | $11,500 | $493,789 | $75,221 | $418,568 |
| 2017 | $11,362 | $478,854 | $70,300 | $408,554 |
| 2016 | $10,013 | $422,031 | $70,300 | $351,731 |
| 2015 | $9,797 | $411,631 | $65,000 | $346,631 |
| 2014 | $9,797 | $404,979 | $0 | $0 |
Source: Public Records
Map
Nearby Homes
- 11100 Alison Parke Trail
- 11007 Opal Trail
- 11000 Anderson Mill Rd Unit 96
- 11000 Anderson Mill Rd Unit 63
- 11533 Sandy Loam Trail
- 11462 Bristle Oak Trail
- 11908 Stout Oak Trail
- 10903 Cade Cir
- 11405 Antler Ln
- 11302 Centennial Trail
- 10606 Mourning Dove Dr
- 11405 Bristle Oak Trail
- 12106 Grey Fawn Path
- 10903 Centennial Trail
- 11612 Tanglebriar Trail
- 1028 Verbena Dr
- 11512 Powder Mill Trail
- 11700 Aloe Vera Cove
- 11506 Powder Mill Trail
- 12206 Saber Trail
- 11127 Alison Parke Trail
- 11127 Alison Park Trail
- 11610 Terrace Parke Trail
- 11131 Alison Parke Trail
- 11117 Alison Park Trail
- 11131 Alison Park Trail
- 11606 Terrace Parke Trail
- 11124 Alison Park Trail
- 11128 Alison Park Trail
- 11120 Alison Park Trail
- 11120 Alison Parke Trail
- 11113 Alison Park Trail
- 11135 Alison Park Trail
- 11116 Alison Park Trail
- 11132 Alison Park Trail
- 11132 Alison Parke Trail
- 11601 Brandon Parke Trail
- 11112 Alison Park Trail
- 11109 Alison Park Trail
- 11136 Alison Park Trail