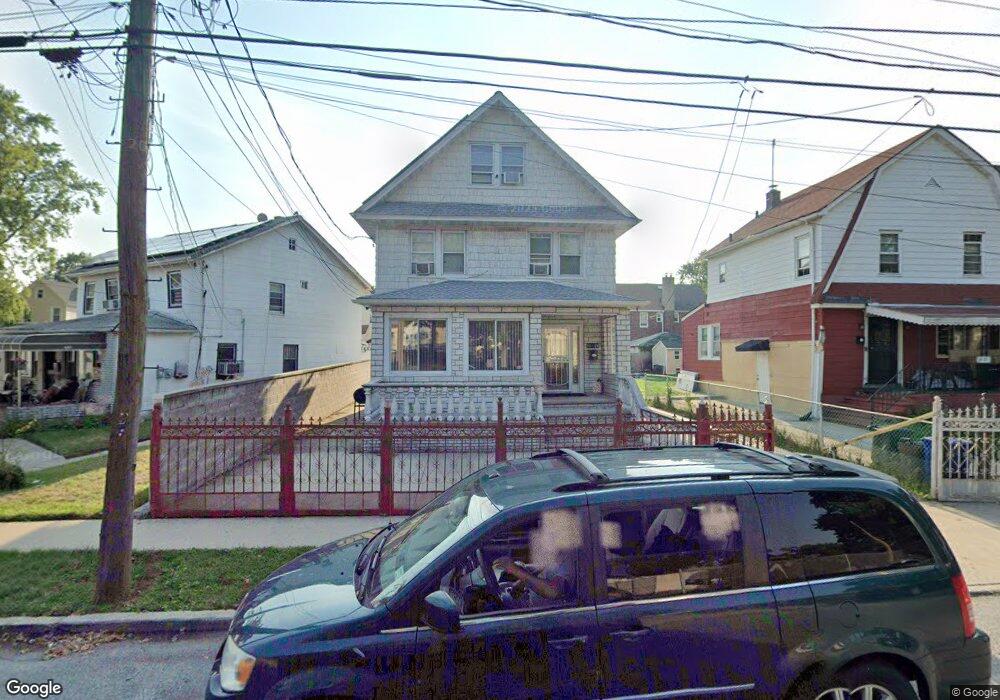
11126 134th St South Ozone Park, NY 11420
South Ozone Park NeighborhoodEstimated Value: $755,000 - $894,000
--
Bed
--
Bath
1,935
Sq Ft
$415/Sq Ft
Est. Value
About This Home
This home is located at 11126 134th St, South Ozone Park, NY 11420 and is currently estimated at $802,504, approximately $414 per square foot. 11126 134th St is a home located in Queens County with nearby schools including P.S. 155, J.H.S. 226 Virgil I. Grisson, and Success Academy Charter School-Nyc 13.
Ownership History
Date
Name
Owned For
Owner Type
Purchase Details
Closed on
Feb 11, 2011
Sold by
Jackman Dievraun and Jackman Sylvia
Bought by
Jackman Sylvia
Current Estimated Value
Purchase Details
Closed on
Dec 23, 2004
Sold by
Carryl Cecil O and Jackman Dievraun
Bought by
Jackman Dievraun and Jackman Sylvia
Purchase Details
Closed on
Feb 19, 2004
Sold by
Carryl Cecil O and Jackman Dievraun
Bought by
Carryl Cecil O and Jackman Dievraun
Purchase Details
Closed on
Sep 5, 1995
Sold by
Ferguson Arthur J and Ferguson Myra A
Bought by
Jackman Dievraun and Carryl Cecil O
Home Financials for this Owner
Home Financials are based on the most recent Mortgage that was taken out on this home.
Original Mortgage
$145,500
Interest Rate
7.81%
Create a Home Valuation Report for This Property
The Home Valuation Report is an in-depth analysis detailing your home's value as well as a comparison with similar homes in the area
Home Values in the Area
Average Home Value in this Area
Purchase History
| Date | Buyer | Sale Price | Title Company |
|---|---|---|---|
| Jackman Sylvia | -- | -- | |
| Jackman Sylvia | -- | -- | |
| Jackman Dievraun | -- | -- | |
| Jackman Dievraun | -- | -- | |
| Carryl Cecil O | -- | -- | |
| Carryl Cecil O | -- | -- | |
| Jackman Dievraun | $150,000 | Commonwealth Land Title Ins | |
| Jackman Dievraun | $150,000 | Commonwealth Land Title Ins |
Source: Public Records
Mortgage History
| Date | Status | Borrower | Loan Amount |
|---|---|---|---|
| Previous Owner | Jackman Dievraun | $145,500 | |
| Closed | Carryl Cecil O | $0 |
Source: Public Records
Tax History Compared to Growth
Tax History
| Year | Tax Paid | Tax Assessment Tax Assessment Total Assessment is a certain percentage of the fair market value that is determined by local assessors to be the total taxable value of land and additions on the property. | Land | Improvement |
|---|---|---|---|---|
| 2025 | $5,918 | $31,726 | $5,744 | $25,982 |
| 2024 | $5,930 | $30,863 | $5,736 | $25,127 |
| 2023 | $5,567 | $29,117 | $5,649 | $23,468 |
| 2022 | $5,307 | $51,960 | $10,080 | $41,880 |
| 2021 | $3,794 | $48,420 | $10,080 | $38,340 |
| 2020 | $3,826 | $45,780 | $10,080 | $35,700 |
| 2019 | $3,613 | $44,580 | $10,080 | $34,500 |
| 2018 | $4,649 | $24,264 | $7,794 | $16,470 |
| 2017 | $4,461 | $23,353 | $7,618 | $15,735 |
| 2016 | $4,095 | $23,353 | $7,618 | $15,735 |
| 2015 | $2,437 | $22,032 | $6,827 | $15,205 |
| 2014 | $2,437 | $21,433 | $7,849 | $13,584 |
Source: Public Records
Map
Nearby Homes
- 111-17 133rd St
- 109-49 132nd St
- 134-01 Linden Blvd
- 109-41 132nd St
- 11406 135th St
- 11409 135th St
- 109-35 131st St
- 11143 130th St
- 114-33 133rd St
- 11408 131st St Unit whole house
- 10922 132nd St
- 114-39 134th St
- 114-29 130th St
- 111-41 128th St
- 11455 131st St
- 132-11 109th Ave
- 13814 111th Ave
- 11120 139th St
- 111-32 139th St
- 107-47 132nd St
- 11122 134th St
- 11136 134th St
- 11118 134th St
- 111-18 134th St
- 11138 134th St
- 111-38 134th St
- 11127 133rd St
- 11123 133rd St
- 11129 133rd St
- 111-16 134th St
- 11140 134th St
- 11119 133rd St
- 11133 133rd St
- 11116 134th St
- 11117 133rd St
- 111-19 133rd St
- 11135 133rd St
- 11142 134th St
- 11115 133rd St
- 11112 134th St