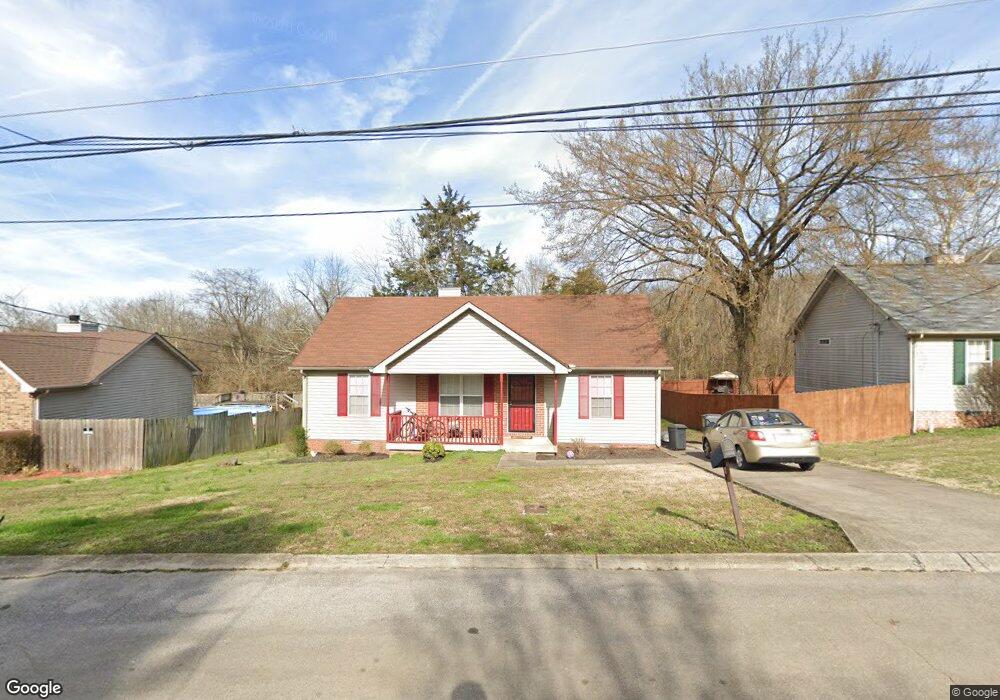
1113 Village Spring Dr Nashville, TN 37207
Bellshire Terrace NeighborhoodEstimated Value: $277,072 - $312,000
3
Beds
2
Baths
1,161
Sq Ft
$253/Sq Ft
Est. Value
About This Home
This home is located at 1113 Village Spring Dr, Nashville, TN 37207 and is currently estimated at $294,268, approximately $253 per square foot. 1113 Village Spring Dr is a home located in Davidson County with nearby schools including Bellshire Elementary Design Center, Madison Middle Prep, and Hunters Lane Comprehensive High School.
Ownership History
Date
Name
Owned For
Owner Type
Purchase Details
Closed on
Feb 20, 2009
Sold by
Abdallah Maryam
Bought by
Burleson Dalmonique R
Current Estimated Value
Home Financials for this Owner
Home Financials are based on the most recent Mortgage that was taken out on this home.
Original Mortgage
$102,017
Outstanding Balance
$64,245
Interest Rate
5.03%
Mortgage Type
FHA
Estimated Equity
$230,023
Purchase Details
Closed on
May 5, 2006
Sold by
Benford Wakus E
Bought by
Hud
Purchase Details
Closed on
Jul 30, 1998
Sold by
Universal Builders Llc
Bought by
Benford Wakus E
Home Financials for this Owner
Home Financials are based on the most recent Mortgage that was taken out on this home.
Original Mortgage
$77,838
Interest Rate
6.94%
Mortgage Type
FHA
Create a Home Valuation Report for This Property
The Home Valuation Report is an in-depth analysis detailing your home's value as well as a comparison with similar homes in the area
Home Values in the Area
Average Home Value in this Area
Purchase History
| Date | Buyer | Sale Price | Title Company |
|---|---|---|---|
| Burleson Dalmonique R | $103,900 | Advantage Title | |
| Hud | $92,417 | None Available | |
| Benford Wakus E | $82,900 | Southeast Title Of Tn Inc |
Source: Public Records
Mortgage History
| Date | Status | Borrower | Loan Amount |
|---|---|---|---|
| Open | Burleson Dalmonique R | $102,017 | |
| Previous Owner | Benford Wakus E | $77,838 | |
| Closed | Benford Wakus E | $6,134 |
Source: Public Records
Tax History Compared to Growth
Tax History
| Year | Tax Paid | Tax Assessment Tax Assessment Total Assessment is a certain percentage of the fair market value that is determined by local assessors to be the total taxable value of land and additions on the property. | Land | Improvement |
|---|---|---|---|---|
| 2024 | $1,684 | $51,750 | $15,000 | $36,750 |
| 2023 | $1,684 | $51,750 | $15,000 | $36,750 |
| 2022 | $1,684 | $51,750 | $15,000 | $36,750 |
| 2021 | $1,702 | $51,750 | $15,000 | $36,750 |
| 2020 | $1,235 | $32,600 | $5,750 | $26,850 |
| 2019 | $898 | $32,600 | $5,750 | $26,850 |
| 2018 | $898 | $32,600 | $5,750 | $26,850 |
| 2017 | $898 | $32,600 | $5,750 | $26,850 |
| 2016 | $977 | $24,900 | $4,500 | $20,400 |
| 2015 | $977 | $24,900 | $4,500 | $20,400 |
| 2014 | $977 | $24,900 | $4,500 | $20,400 |
Source: Public Records
Map
Nearby Homes
- 4348 Skyridge Dr
- 4325 Skyridge Dr
- 3136 Lauren Evelyn Way
- 3116 Lauren Evelyn Way
- 4683 Ridge Bend Dr
- 3172 Lauren Evelyn Way
- 4125 Walnut Ridge Dr
- 4105 Walnut Ridge Dr
- 4113 Walnut Ridge Dr
- 4264 Skyridge Dr
- 4108 Walnut Ridge Dr
- 3253 Rainwood Dr
- 3946 Northbrook Dr
- 116 Tiger Cir
- 1832 Apple Valley Cir
- 3313 Leondale Terrace
- 3247 Masonwood Dr
- 3320 Chesapeake Cir
- 3525 Brookway Dr
- 3529 Brookway Dr
- 1117 Village Spring Dr
- 1109 Village Spring Dr
- 1105 Village Spring Dr
- 1112 Village Spring Dr
- 1121 Village Spring Dr
- 1108 Village Spring Dr
- 3812 Village Trail
- 1104 Village Spring Dr
- 3808 Village Trail
- 3816 Village Trail
- 612 Chester Hughes Ct
- 3313 Valley Creek Ln
- 3309 Valley Creek Ln
- 3804 Village Trail
- 613 Chester Hughes Ct
- 3820 Village Trail
- 4503 Skywood Ln
- 3317 Valley Creek Ln
- 3305 Valley Creek Ln
- 609 Chester Hughes Ct