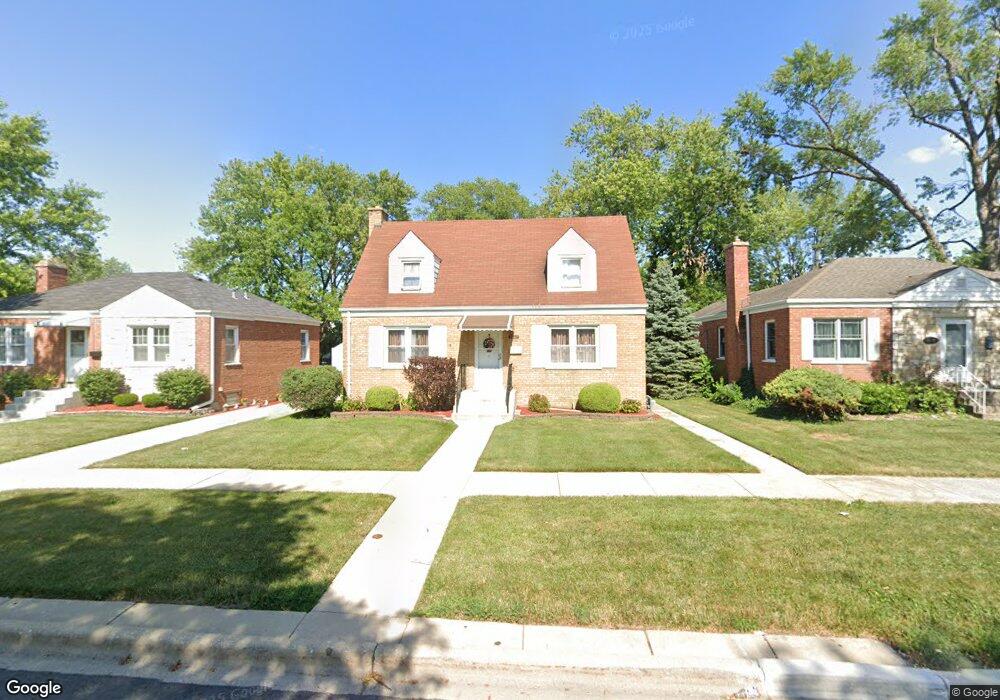
1113 Westchester Blvd Westchester, IL 60154
Estimated Value: $345,028 - $366,000
3
Beds
2
Baths
1,471
Sq Ft
$242/Sq Ft
Est. Value
About This Home
This home is located at 1113 Westchester Blvd, Westchester, IL 60154 and is currently estimated at $356,007, approximately $242 per square foot. 1113 Westchester Blvd is a home located in Cook County with nearby schools including Westchester Primary School, Westchester Intermediate School, and Westchester Middle School.
Ownership History
Date
Name
Owned For
Owner Type
Purchase Details
Closed on
Jun 10, 2013
Sold by
Salamanca Janette and Maldonado Juan
Bought by
Salamanca Maldonado Juan and Salamanca Maldonado Janette
Current Estimated Value
Home Financials for this Owner
Home Financials are based on the most recent Mortgage that was taken out on this home.
Original Mortgage
$147,465
Outstanding Balance
$103,769
Interest Rate
3.25%
Mortgage Type
FHA
Estimated Equity
$252,238
Purchase Details
Closed on
Apr 13, 2011
Sold by
Ehman Leo W
Bought by
Salamanca Janette
Home Financials for this Owner
Home Financials are based on the most recent Mortgage that was taken out on this home.
Original Mortgage
$151,070
Interest Rate
5.12%
Mortgage Type
FHA
Create a Home Valuation Report for This Property
The Home Valuation Report is an in-depth analysis detailing your home's value as well as a comparison with similar homes in the area
Home Values in the Area
Average Home Value in this Area
Purchase History
| Date | Buyer | Sale Price | Title Company |
|---|---|---|---|
| Salamanca Maldonado Juan | -- | National Title Solutions Inc | |
| Salamanca Janette | $155,000 | Chicago Title Insurance Co |
Source: Public Records
Mortgage History
| Date | Status | Borrower | Loan Amount |
|---|---|---|---|
| Open | Salamanca Maldonado Juan | $147,465 | |
| Closed | Salamanca Janette | $151,070 |
Source: Public Records
Tax History Compared to Growth
Tax History
| Year | Tax Paid | Tax Assessment Tax Assessment Total Assessment is a certain percentage of the fair market value that is determined by local assessors to be the total taxable value of land and additions on the property. | Land | Improvement |
|---|---|---|---|---|
| 2024 | $5,691 | $25,000 | $3,281 | $21,719 |
| 2023 | $5,909 | $25,000 | $3,281 | $21,719 |
| 2022 | $5,909 | $22,790 | $2,888 | $19,902 |
| 2021 | $5,746 | $22,789 | $2,887 | $19,902 |
| 2020 | $5,680 | $22,789 | $2,887 | $19,902 |
| 2019 | $4,634 | $19,834 | $2,625 | $17,209 |
| 2018 | $4,572 | $19,834 | $2,625 | $17,209 |
| 2017 | $4,501 | $19,834 | $2,625 | $17,209 |
| 2016 | $3,742 | $15,327 | $2,362 | $12,965 |
| 2015 | $3,657 | $15,327 | $2,362 | $12,965 |
| 2014 | $3,588 | $15,327 | $2,362 | $12,965 |
| 2013 | $4,227 | $16,813 | $2,362 | $14,451 |
Source: Public Records
Map
Nearby Homes
- 1119 Newcastle Ave
- 10072 Drury Ln
- 920 Suffolk Ave
- 814 Norfolk Ave
- 723 Balmoral Ave
- 1247 S Mannheim Rd Unit 3
- 805 Norfolk Ave
- 923 Manchester Ave
- 750 Bristol Ave
- 1136 Park Place
- 626 Manchester Ave
- 1102 Marshall Ave
- 1035 Bohland Ave
- 1500 Bristol Ave
- 10524 Camelot St
- 1108 31st Ave
- 1102 31st Ave
- 10531 Camelot St
- 1023 Rice Ave
- 1013 Bellwood Ave
- 1109 Westchester Blvd
- 1103 Westchester Blvd
- 1108 Hull Ave
- 1114 Hull Ave
- 1104 Hull Ave
- 1120 Hull Ave
- 1100 Hull Ave
- 1131 Westchester Blvd
- 1131 Westchester Blvd
- 1110 Westchester Blvd
- 1106 Westchester Blvd
- 1025 Westchester Blvd
- 1100 Westchester Blvd
- 1024 Hull Ave
- 1137 Westchester Blvd
- 1137 Westchester Blvd
- 1028 Westchester Blvd
- 10143 The Strand
- 1017 Westchester Blvd
- 1018 Hull Ave