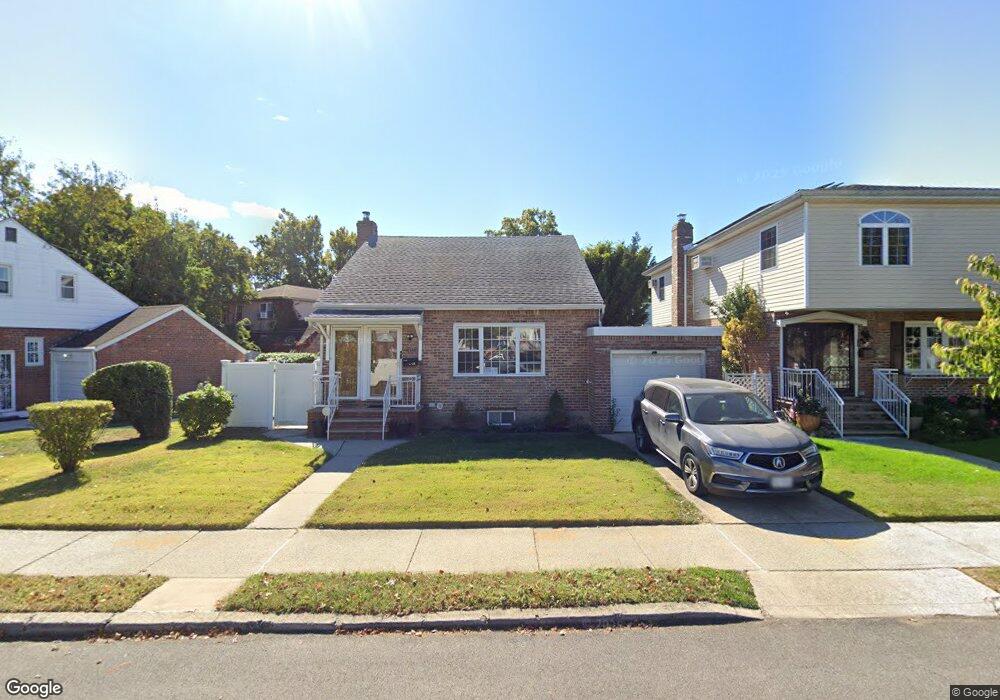
11148 179th Place Jamaica, NY 11433
Saint Albans NeighborhoodEstimated Value: $629,247 - $818,000
--
Bed
--
Bath
1,340
Sq Ft
$538/Sq Ft
Est. Value
About This Home
This home is located at 11148 179th Place, Jamaica, NY 11433 and is currently estimated at $720,562, approximately $537 per square foot. 11148 179th Place is a home located in Queens County with nearby schools including Ps 36 St Albans School, Is 59 Springfield Gardens, and Allen Christian School.
Ownership History
Date
Name
Owned For
Owner Type
Purchase Details
Closed on
Jul 11, 2014
Sold by
Deutsche Bank National Trust Company Tr
Bought by
Akande Olawale S
Current Estimated Value
Home Financials for this Owner
Home Financials are based on the most recent Mortgage that was taken out on this home.
Original Mortgage
$352,894
Interest Rate
4.1%
Mortgage Type
New Conventional
Purchase Details
Closed on
Oct 23, 2009
Sold by
Grovine Mattone Esq As Referee
Bought by
2006-Wmc2 and Deutsche Bank National Trust Company, As
Purchase Details
Closed on
Mar 10, 2006
Sold by
Rodriguez Ifran
Bought by
Mcfarlane Dave and Mc Farlane Osmond
Home Financials for this Owner
Home Financials are based on the most recent Mortgage that was taken out on this home.
Original Mortgage
$445,200
Interest Rate
6.26%
Mortgage Type
Purchase Money Mortgage
Create a Home Valuation Report for This Property
The Home Valuation Report is an in-depth analysis detailing your home's value as well as a comparison with similar homes in the area
Home Values in the Area
Average Home Value in this Area
Purchase History
| Date | Buyer | Sale Price | Title Company |
|---|---|---|---|
| Akande Olawale S | $359,970 | -- | |
| 2006-Wmc2 | $487,255 | -- | |
| Mcfarlane Dave | $556,500 | -- |
Source: Public Records
Mortgage History
| Date | Status | Borrower | Loan Amount |
|---|---|---|---|
| Previous Owner | Akande Olawale S | $352,894 | |
| Previous Owner | Mcfarlane Dave | $445,200 | |
| Closed | Mcfarlane Dave | $111,300 |
Source: Public Records
Tax History Compared to Growth
Tax History
| Year | Tax Paid | Tax Assessment Tax Assessment Total Assessment is a certain percentage of the fair market value that is determined by local assessors to be the total taxable value of land and additions on the property. | Land | Improvement |
|---|---|---|---|---|
| 2025 | $6,208 | $32,556 | $9,780 | $22,776 |
| 2024 | $6,220 | $32,310 | $9,641 | $22,669 |
| 2023 | $5,841 | $30,481 | $9,907 | $20,574 |
| 2022 | $5,454 | $37,740 | $13,320 | $24,420 |
| 2021 | $5,414 | $32,580 | $13,320 | $19,260 |
| 2020 | $5,447 | $33,300 | $13,320 | $19,980 |
| 2019 | $5,340 | $31,200 | $13,320 | $17,880 |
| 2018 | $4,880 | $25,401 | $11,369 | $14,032 |
| 2017 | $4,585 | $23,964 | $10,640 | $13,324 |
| 2016 | $4,210 | $23,964 | $10,640 | $13,324 |
| 2015 | $2,727 | $22,608 | $12,009 | $10,599 |
| 2014 | $2,727 | $22,438 | $12,539 | $9,899 |
Source: Public Records
Map
Nearby Homes
- 11176 180th St
- 111-54 178th Place
- 112- 2 178th St
- 112-13 178th St
- 17709 112th Ave
- 179-07 Murdock Ave
- 17718 Sayres Ave
- 112-45 178th St
- 177-08 Sayres Ave
- 183-34 Fonda Ave
- 112-26 176th St
- 183-12 Elmira Ave
- 183-29 Brinkerhoff Ave
- 110-40 176th St
- 186-16 Hilburn Ave
- 10944 177th St
- 109-49 176th St
- 183-09 Dunlop Ave
- 188-07 Mangin Ave
- 110-01 175th St
- 111-48 179th Place
- 111-48 179th Place Unit 2nd Fl
- 11144 179th Place
- 11164 180th St
- 11140 179th Place
- 11168 180th St
- 11147 179th St
- 11151 179th St
- 11143 179th St
- 11147 179th St
- 11136 179th Place
- 11155 179th St
- 11137 179th St
- 11172 179th St
- 11137 179th Place
- 11132 179th Place
- 11159 179th St
- 11133 179th St
- 11129 179th St
- 11163 179th St