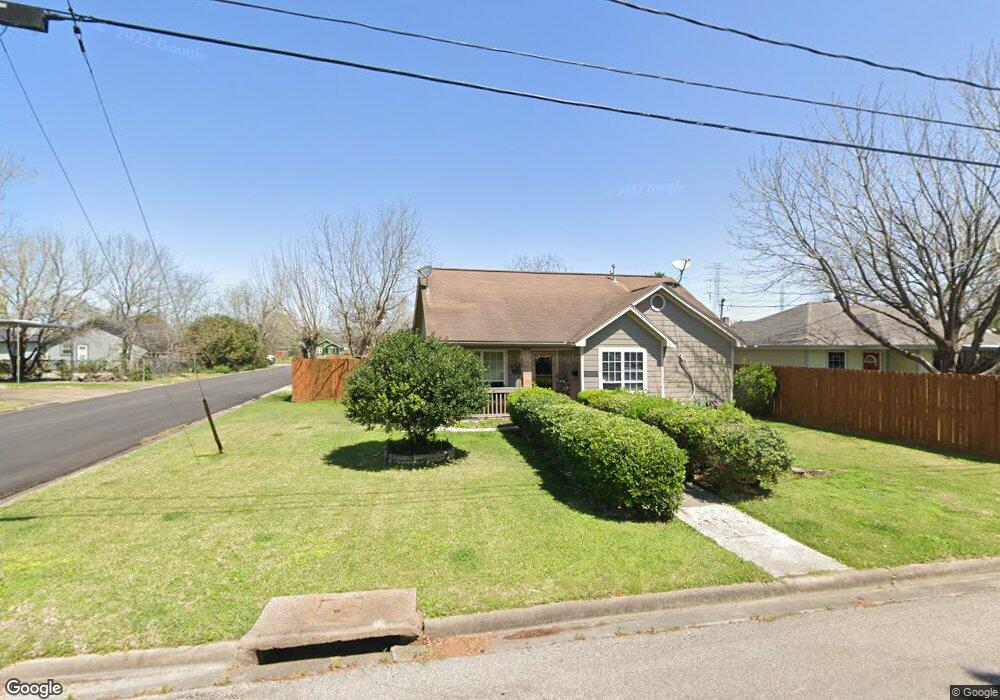
1115 11th St Galena Park, TX 77547
Estimated Value: $148,000 - $169,000
3
Beds
2
Baths
1,070
Sq Ft
$150/Sq Ft
Est. Value
About This Home
This home is located at 1115 11th St, Galena Park, TX 77547 and is currently estimated at $160,562, approximately $150 per square foot. 1115 11th St is a home located in Harris County with nearby schools including MacArthur Elementary School, Galena Park Middle School, and Galena Park High School.
Ownership History
Date
Name
Owned For
Owner Type
Purchase Details
Closed on
Sep 30, 2003
Sold by
Hidalgo Juan and Hidalgo Idalia
Bought by
Anaya Roel and Anaya Isabel
Current Estimated Value
Home Financials for this Owner
Home Financials are based on the most recent Mortgage that was taken out on this home.
Original Mortgage
$86,000
Interest Rate
5.6%
Mortgage Type
Purchase Money Mortgage
Purchase Details
Closed on
Nov 8, 2002
Sold by
Guthrie Vernon L and Guthrie Glenda
Bought by
Hidalgo Juan and Hidalgo Idalia
Create a Home Valuation Report for This Property
The Home Valuation Report is an in-depth analysis detailing your home's value as well as a comparison with similar homes in the area
Home Values in the Area
Average Home Value in this Area
Purchase History
| Date | Buyer | Sale Price | Title Company |
|---|---|---|---|
| Anaya Roel | -- | Texas American Title Company | |
| Hidalgo Juan | -- | -- |
Source: Public Records
Mortgage History
| Date | Status | Borrower | Loan Amount |
|---|---|---|---|
| Closed | Anaya Roel | $86,000 |
Source: Public Records
Tax History Compared to Growth
Tax History
| Year | Tax Paid | Tax Assessment Tax Assessment Total Assessment is a certain percentage of the fair market value that is determined by local assessors to be the total taxable value of land and additions on the property. | Land | Improvement |
|---|---|---|---|---|
| 2025 | $2,152 | $179,265 | $55,688 | $123,577 |
| 2024 | $2,152 | $165,846 | $55,688 | $110,158 |
| 2023 | $2,152 | $177,797 | $44,297 | $133,500 |
| 2022 | $3,185 | $149,537 | $28,350 | $121,187 |
| 2021 | $3,235 | $126,320 | $28,350 | $97,970 |
| 2020 | $3,085 | $116,896 | $28,350 | $88,546 |
| 2019 | $2,957 | $115,391 | $28,350 | $87,041 |
| 2018 | $557 | $75,482 | $15,188 | $60,294 |
| 2017 | $2,349 | $68,717 | $12,656 | $56,061 |
| 2016 | $2,260 | $68,717 | $12,656 | $56,061 |
| 2015 | $1,539 | $60,116 | $12,656 | $47,460 |
| 2014 | $1,539 | $60,116 | $12,656 | $47,460 |
Source: Public Records
Map
Nearby Homes