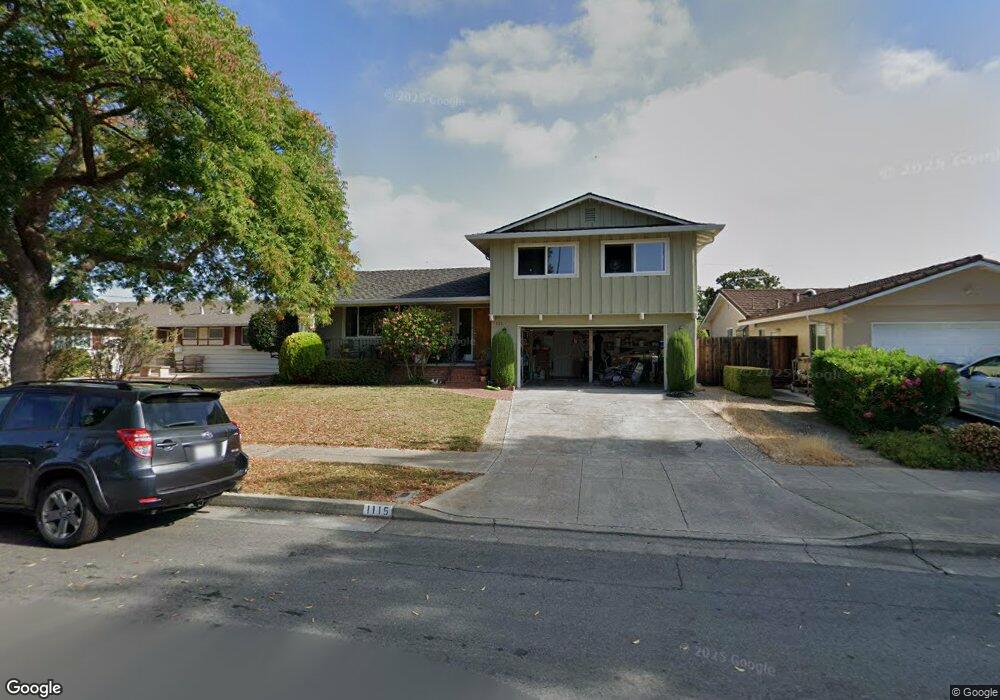
1115 Viscaino Ave Sunnyvale, CA 94086
Estimated Value: $2,290,000 - $2,748,000
4
Beds
3
Baths
1,828
Sq Ft
$1,425/Sq Ft
Est. Value
About This Home
This home is located at 1115 Viscaino Ave, Sunnyvale, CA 94086 and is currently estimated at $2,604,219, approximately $1,424 per square foot. 1115 Viscaino Ave is a home located in Santa Clara County with nearby schools including Vargas Elementary School, Sunnyvale Middle School, and Homestead High School.
Ownership History
Date
Name
Owned For
Owner Type
Purchase Details
Closed on
Mar 19, 1997
Sold by
Wachman Matthew
Bought by
Judkins James and Judkins Shelley
Current Estimated Value
Home Financials for this Owner
Home Financials are based on the most recent Mortgage that was taken out on this home.
Original Mortgage
$348,800
Outstanding Balance
$35,912
Interest Rate
6%
Estimated Equity
$2,568,307
Purchase Details
Closed on
Jul 9, 1996
Sold by
Musgrave Ernest M and Musgrave Marie
Bought by
Wachsman Matthew
Home Financials for this Owner
Home Financials are based on the most recent Mortgage that was taken out on this home.
Original Mortgage
$296,000
Interest Rate
8.3%
Create a Home Valuation Report for This Property
The Home Valuation Report is an in-depth analysis detailing your home's value as well as a comparison with similar homes in the area
Home Values in the Area
Average Home Value in this Area
Purchase History
| Date | Buyer | Sale Price | Title Company |
|---|---|---|---|
| Judkins James | $436,000 | North American Title Co | |
| Wachsman Matthew | -- | North American Title Co | |
| Wachsman Matthew | $370,000 | North American Title Co | |
| Wachsman Matthew | -- | North American Title Co |
Source: Public Records
Mortgage History
| Date | Status | Borrower | Loan Amount |
|---|---|---|---|
| Open | Judkins James | $348,800 | |
| Previous Owner | Wachsman Matthew | $296,000 | |
| Closed | Wachsman Matthew | $55,500 |
Source: Public Records
Tax History Compared to Growth
Tax History
| Year | Tax Paid | Tax Assessment Tax Assessment Total Assessment is a certain percentage of the fair market value that is determined by local assessors to be the total taxable value of land and additions on the property. | Land | Improvement |
|---|---|---|---|---|
| 2025 | $8,212 | $710,086 | $309,440 | $400,646 |
| 2024 | $8,212 | $696,164 | $303,373 | $392,791 |
| 2023 | $8,136 | $682,515 | $297,425 | $385,090 |
| 2022 | $8,010 | $669,134 | $291,594 | $377,540 |
| 2021 | $7,932 | $656,015 | $285,877 | $370,138 |
| 2020 | $7,832 | $649,289 | $282,946 | $366,343 |
| 2019 | $7,658 | $636,559 | $277,399 | $359,160 |
| 2018 | $7,506 | $624,078 | $271,960 | $352,118 |
| 2017 | $7,408 | $611,842 | $266,628 | $345,214 |
| 2016 | $7,119 | $599,846 | $261,400 | $338,446 |
| 2015 | $7,158 | $590,837 | $257,474 | $333,363 |
| 2014 | $7,017 | $579,264 | $252,431 | $326,833 |
Source: Public Records
Map
Nearby Homes
- 1127 Viscaino Ave
- 246 Leota Ave
- 1033 Crestview Dr Unit 308
- 1021 Golf Ct
- 434 Purisima Ave
- 1201 Heatherstone Way
- 857 Peach Ave
- 433 Sylvan Ave
- 433 Sylvan Ave Unit 113
- 433 Sylvan Ave Unit 84
- 960 Heatherstone Ave
- 991 Asilomar Terrace Unit 1
- 987 Asilomar Terrace Unit 2
- 839 Coolidge Ave
- 496 Kahlo St
- 325 Sylvan Ave
- 745 Reseda Dr
- 984 Belmont Terrace Unit 10
- 971 Belmont Terrace Unit 9
- 541 Holthouse Terrace
- 1111 Viscaino Ave
- 1121 Viscaino Ave
- 1116 Vasquez Ave
- 1122 Vasquez Ave
- 1112 Vasquez Ave
- 1105 Viscaino Ave
- 1128 Vasquez Ave
- 1106 Vasquez Ave
- 1116 Viscaino Ave
- 1122 Viscaino Ave
- 1112 Viscaino Ave
- 1135 Viscaino Ave
- 1101 Viscaino Ave
- 1128 Viscaino Ave
- 1136 Vasquez Ave
- 1102 Vasquez Ave
- 1136 Viscaino Ave
- 1102 Viscaino Ave
- 1141 Viscaino Ave
- 1115 Vasquez Ave