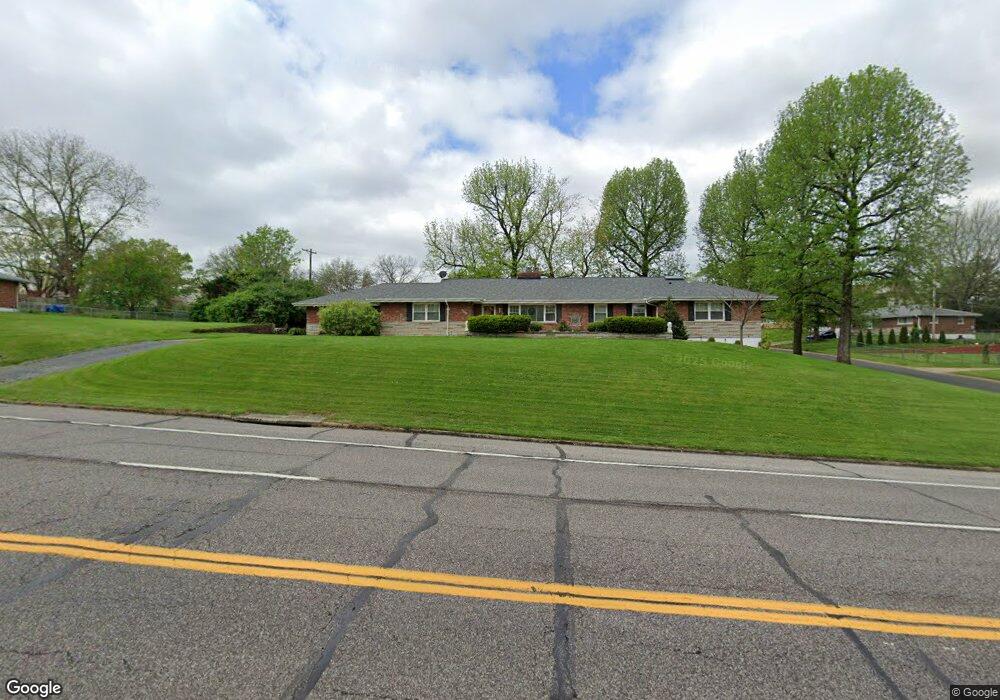
1116 Reavis Barracks Rd Saint Louis, MO 63125
Mehlville NeighborhoodEstimated Value: $292,000 - $441,000
3
Beds
3
Baths
2,741
Sq Ft
$137/Sq Ft
Est. Value
About This Home
This home is located at 1116 Reavis Barracks Rd, Saint Louis, MO 63125 and is currently estimated at $376,229, approximately $137 per square foot. 1116 Reavis Barracks Rd is a home located in St. Louis County with nearby schools including Forder Elementary School, Margaret Buerkle Middle School, and Mehlville High School.
Ownership History
Date
Name
Owned For
Owner Type
Purchase Details
Closed on
Feb 22, 2013
Sold by
Cobb John G
Bought by
Randolph Gary D and Randolph Kimberly A
Current Estimated Value
Home Financials for this Owner
Home Financials are based on the most recent Mortgage that was taken out on this home.
Original Mortgage
$165,000
Interest Rate
3.44%
Mortgage Type
New Conventional
Purchase Details
Closed on
Dec 8, 2012
Sold by
Goetz Robert A and Cobb John G
Bought by
Cobb John G
Purchase Details
Closed on
Dec 1, 2012
Sold by
Sekarski Joseph and Cobb John G
Bought by
Cobb John G
Purchase Details
Closed on
May 9, 2005
Sold by
Goetz Robert A
Bought by
Sekarski Joseph
Purchase Details
Closed on
Aug 26, 2004
Sold by
Sayles Kevin L
Bought by
Goetz Robert A
Purchase Details
Closed on
Nov 24, 1999
Sold by
Meyer Anita R
Bought by
Sayles Kevin L
Create a Home Valuation Report for This Property
The Home Valuation Report is an in-depth analysis detailing your home's value as well as a comparison with similar homes in the area
Home Values in the Area
Average Home Value in this Area
Purchase History
| Date | Buyer | Sale Price | Title Company |
|---|---|---|---|
| Randolph Gary D | $220,000 | Ctc | |
| Cobb John G | -- | Continental Title Company | |
| Cobb John G | -- | Continental Title Company | |
| Cobb John G | -- | Continental Title Company | |
| Sekarski Joseph | -- | -- | |
| Goetz Robert A | -- | -- | |
| Sayles Kevin L | $165,000 | -- |
Source: Public Records
Mortgage History
| Date | Status | Borrower | Loan Amount |
|---|---|---|---|
| Previous Owner | Randolph Gary D | $165,000 |
Source: Public Records
Tax History Compared to Growth
Tax History
| Year | Tax Paid | Tax Assessment Tax Assessment Total Assessment is a certain percentage of the fair market value that is determined by local assessors to be the total taxable value of land and additions on the property. | Land | Improvement |
|---|---|---|---|---|
| 2025 | $3,666 | $73,760 | $21,280 | $52,480 |
| 2024 | $3,666 | $54,110 | $13,870 | $40,240 |
| 2023 | $3,619 | $54,110 | $13,870 | $40,240 |
| 2022 | $3,857 | $53,580 | $13,870 | $39,710 |
| 2021 | $3,421 | $53,580 | $13,870 | $39,710 |
| 2020 | $3,620 | $53,940 | $13,130 | $40,810 |
| 2019 | $3,609 | $53,940 | $13,130 | $40,810 |
| 2018 | $3,091 | $41,670 | $7,560 | $34,110 |
| 2017 | $3,087 | $41,670 | $7,560 | $34,110 |
| 2016 | $2,956 | $38,270 | $6,710 | $31,560 |
| 2015 | $2,771 | $38,270 | $6,710 | $31,560 |
| 2014 | $3,266 | $44,720 | $12,270 | $32,450 |
Source: Public Records
Map
Nearby Homes
- 1153 Calley Dr Unit 1153
- 1275 Gardens Circle Dr Unit A
- 2460 Lampong Dr Unit 100C
- 669 Vista Conn Dr
- 2216 Apple Bud Ln
- 2669 Jonathan Dr
- 645 Vista Conn Dr
- 2215 Apple Bud Ln
- 660 Rochester Dr
- 669 Bellsworth Dr
- 32 Buckley Meadows Dr
- 2105 Telford Dr
- 2228 Hagenstone Terrace
- 502 Nannette Dr
- 600 Ellwine Dr
- 1716 Mayenne Ct Unit E
- 800 Dumont Place Unit B
- 1745 Herault Place Unit E
- 1725 Herault Place Unit G
- 846 Dumont Place
- 1123 Rainbow Dr
- 1104 Reavis Barracks Rd
- 1113 Roxbury Dr
- 1109 Roxbury Dr
- 1128 Rainbow Dr
- 1111 Reavis Barracks Rd
- 1100 Reavis Barracks Rd
- 1105 Roxbury Dr
- 1124 Rainbow Dr
- 1109 Reavis Barracks Rd
- 2247 Rainbow Dr
- 0TBB Peppermil
- 1128 Reavis Barracks Rd
- 1105 Reavis Barracks Rd
- 1101 Roxbury Dr
- 1034 Reavis Barracks Rd
- 1116 Rainbow Dr
- 1120 Rainbow Dr
- 2242 Rainbow Dr
- 1112 Rainbow Dr