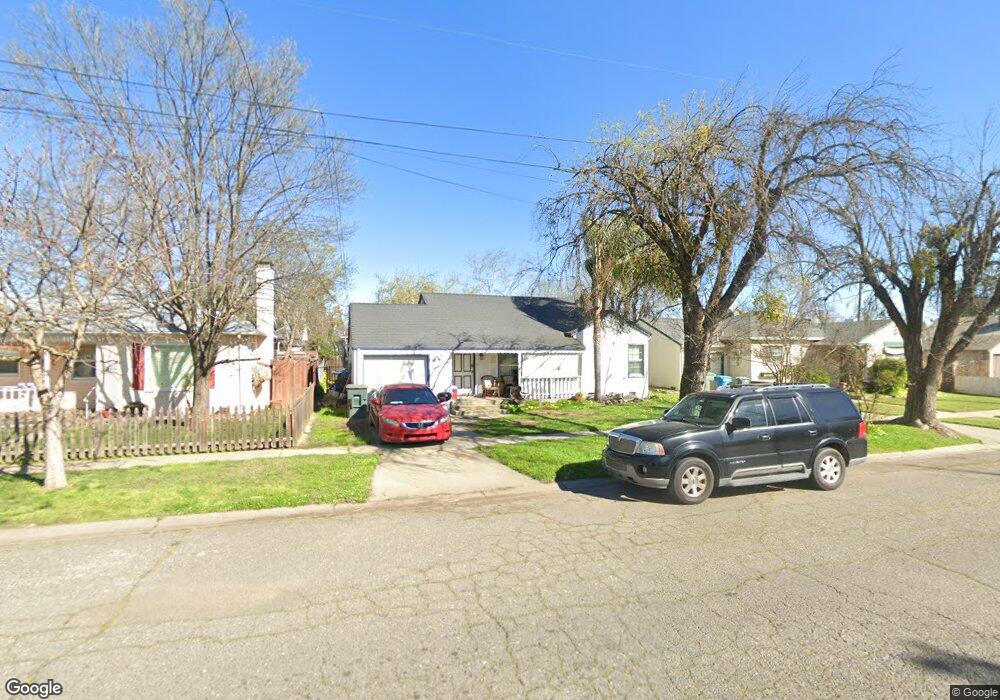
1117 Swezy St Marysville, CA 95901
Estimated Value: $106,000 - $301,290
3
Beds
2
Baths
1,269
Sq Ft
$182/Sq Ft
Est. Value
About This Home
This home is located at 1117 Swezy St, Marysville, CA 95901 and is currently estimated at $230,823, approximately $181 per square foot. 1117 Swezy St is a home located in Yuba County with nearby schools including Kynoch Elementary School, Anna McKenney Intermediate, and Marysville High School.
Ownership History
Date
Name
Owned For
Owner Type
Purchase Details
Closed on
Sep 3, 2009
Sold by
The Bank Of New York Mellon
Bought by
Heryford Steven P and Heryford Carrie L
Current Estimated Value
Purchase Details
Closed on
Aug 6, 2009
Sold by
Mcbean John
Bought by
The Bank Of New York Mellon
Purchase Details
Closed on
Jul 11, 2005
Sold by
Liabraaten Benjamin J
Bought by
Mcbean John and Mcbean Christitna
Home Financials for this Owner
Home Financials are based on the most recent Mortgage that was taken out on this home.
Original Mortgage
$203,920
Interest Rate
5.5%
Mortgage Type
Fannie Mae Freddie Mac
Purchase Details
Closed on
Jul 2, 2002
Sold by
Brink Gerald R
Bought by
Liabraaten Benjamin J and Liabraaten Tamara J
Home Financials for this Owner
Home Financials are based on the most recent Mortgage that was taken out on this home.
Original Mortgage
$88,000
Interest Rate
6.71%
Mortgage Type
Purchase Money Mortgage
Create a Home Valuation Report for This Property
The Home Valuation Report is an in-depth analysis detailing your home's value as well as a comparison with similar homes in the area
Home Values in the Area
Average Home Value in this Area
Purchase History
| Date | Buyer | Sale Price | Title Company |
|---|---|---|---|
| Heryford Steven P | $77,000 | Orange Coast Title Lender Se | |
| The Bank Of New York Mellon | $92,500 | None Available | |
| Mcbean John | $255,000 | Placer Title Company | |
| Liabraaten Benjamin J | $110,000 | First American Title Ins Co |
Source: Public Records
Mortgage History
| Date | Status | Borrower | Loan Amount |
|---|---|---|---|
| Previous Owner | Mcbean John | $203,920 | |
| Previous Owner | Liabraaten Benjamin J | $88,000 | |
| Closed | Liabraaten Benjamin J | $22,000 |
Source: Public Records
Tax History Compared to Growth
Tax History
| Year | Tax Paid | Tax Assessment Tax Assessment Total Assessment is a certain percentage of the fair market value that is determined by local assessors to be the total taxable value of land and additions on the property. | Land | Improvement |
|---|---|---|---|---|
| 2025 | $1,178 | $99,379 | $25,809 | $73,570 |
| 2023 | $1,178 | $95,521 | $24,807 | $70,714 |
| 2022 | $1,142 | $93,649 | $24,321 | $69,328 |
| 2021 | $1,129 | $91,814 | $23,845 | $67,969 |
| 2020 | $1,119 | $90,874 | $23,601 | $67,273 |
| 2019 | $1,097 | $89,093 | $23,139 | $65,954 |
| 2018 | $1,077 | $87,347 | $22,686 | $64,661 |
| 2017 | $1,046 | $85,636 | $22,242 | $63,394 |
| 2016 | $1,038 | $83,957 | $21,806 | $62,151 |
| 2015 | $1,017 | $82,697 | $21,479 | $61,218 |
| 2014 | $1,002 | $81,078 | $21,059 | $60,019 |
Source: Public Records
Map
Nearby Homes