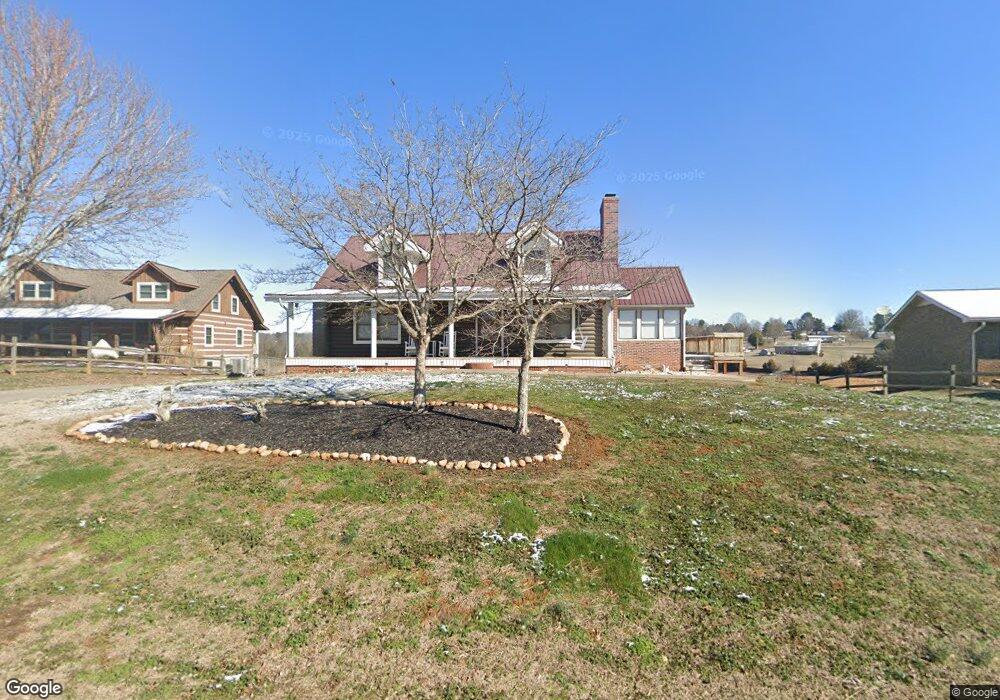
1118 Lake Ridge Dr Dandridge, TN 37725
Estimated Value: $818,000 - $994,000
--
Bed
2
Baths
2,800
Sq Ft
$310/Sq Ft
Est. Value
About This Home
This home is located at 1118 Lake Ridge Dr, Dandridge, TN 37725 and is currently estimated at $866,945, approximately $309 per square foot. 1118 Lake Ridge Dr is a home located in Jefferson County.
Ownership History
Date
Name
Owned For
Owner Type
Purchase Details
Closed on
Jul 16, 2018
Sold by
Rimmer Robert T
Bought by
Faller Michael E and Faller Evelyn
Current Estimated Value
Home Financials for this Owner
Home Financials are based on the most recent Mortgage that was taken out on this home.
Original Mortgage
$333,000
Outstanding Balance
$246,118
Interest Rate
4.5%
Mortgage Type
New Conventional
Estimated Equity
$620,827
Purchase Details
Closed on
Oct 13, 2004
Sold by
Daniels Ralph E Trustee
Bought by
Rimmer Robert T
Home Financials for this Owner
Home Financials are based on the most recent Mortgage that was taken out on this home.
Original Mortgage
$236,000
Interest Rate
5.71%
Purchase Details
Closed on
Jul 9, 2001
Bought by
Daniels Ralph Eugene & Anna Bea Trustees
Purchase Details
Closed on
Aug 11, 1988
Bought by
Neal Glen L and Neal Ursula
Purchase Details
Closed on
Aug 28, 1982
Bought by
Frazier Stanley E and Frazier Rebecca S
Create a Home Valuation Report for This Property
The Home Valuation Report is an in-depth analysis detailing your home's value as well as a comparison with similar homes in the area
Home Values in the Area
Average Home Value in this Area
Purchase History
| Date | Buyer | Sale Price | Title Company |
|---|---|---|---|
| Faller Michael E | $370,000 | None Available | |
| Rimmer Robert T | $295,000 | -- | |
| Daniels Ralph Eugene & Anna Bea Trustees | $210,000 | -- | |
| Neal Glen L | $16,000 | -- | |
| Frazier Stanley E | -- | -- |
Source: Public Records
Mortgage History
| Date | Status | Borrower | Loan Amount |
|---|---|---|---|
| Open | Faller Michael E | $333,000 | |
| Previous Owner | Frazier Stanley E | $236,000 |
Source: Public Records
Tax History Compared to Growth
Tax History
| Year | Tax Paid | Tax Assessment Tax Assessment Total Assessment is a certain percentage of the fair market value that is determined by local assessors to be the total taxable value of land and additions on the property. | Land | Improvement |
|---|---|---|---|---|
| 2025 | $2,599 | $181,725 | $65,000 | $116,725 |
| 2023 | $2,303 | $100,150 | $0 | $0 |
| 2022 | $2,193 | $100,150 | $40,000 | $60,150 |
| 2021 | $2,193 | $100,150 | $40,000 | $60,150 |
| 2020 | $2,193 | $100,150 | $40,000 | $60,150 |
| 2019 | $2,193 | $100,150 | $40,000 | $60,150 |
| 2018 | $2,171 | $92,375 | $40,000 | $52,375 |
| 2017 | $2,171 | $92,375 | $40,000 | $52,375 |
| 2016 | $2,171 | $92,375 | $40,000 | $52,375 |
| 2015 | $2,171 | $92,375 | $40,000 | $52,375 |
| 2014 | $2,171 | $92,375 | $40,000 | $52,375 |
Source: Public Records
Map
Nearby Homes
- 1120 Lake Ridge Dr
- 1122 Lake Ridge Dr
- 1115 Lake Ridge Dr
- 1121 Lake Ridge Dr
- 915 Barton Cir
- 1113 Lake Ridge Dr
- Lot 39 Lake Ridge Dr
- 0 Lots 43 & 44 Lake Ridge Dr Unit 253373
- 0 Lots 43 & 44 Lake Ridge Dr Unit 609346
- Lots 43 & 44 Lake Ridge Dr
- 1107 Lake Ridge Dr
- 5556 Lake Ridge Dr
- 1143 Lake Ridge Dr
- 1105 Lake Ridge Dr
- 1779 Circle Lake Dr
- 1777 Circle Lake Dr
- 1101 Lake Ridge Dr
- 1146 Lake Ridge Dr
- 1145 Lake Ridge Dr
- 1097 Lake Ridge Dr