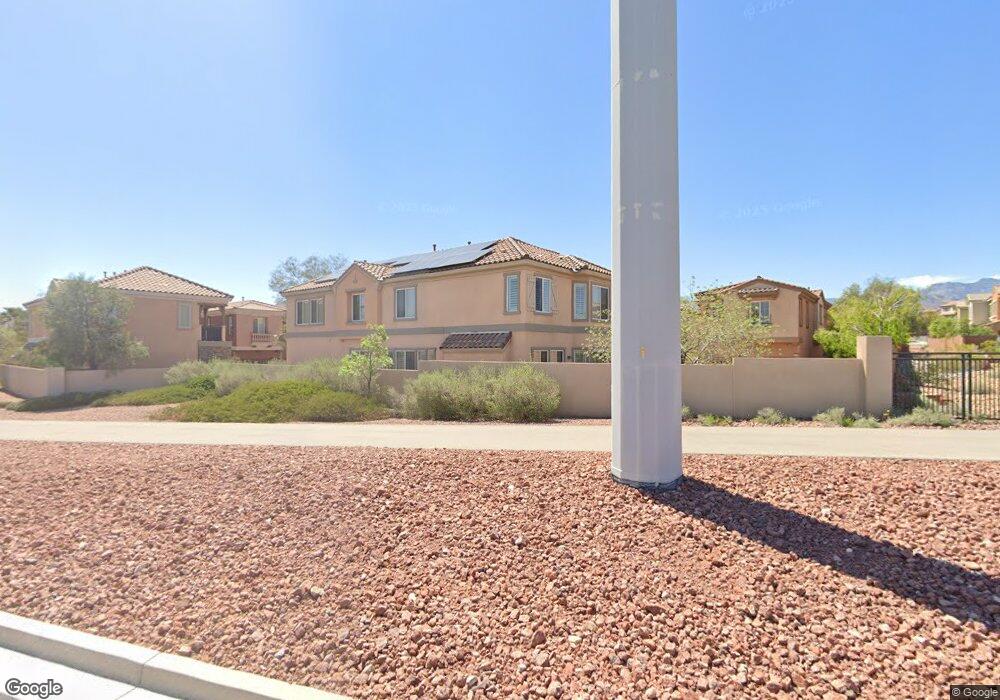
11186 Corsica Mist Ave Las Vegas, NV 89135
Summerlin NeighborhoodEstimated Value: $688,899 - $805,000
2
Beds
3
Baths
2,318
Sq Ft
$323/Sq Ft
Est. Value
About This Home
This home is located at 11186 Corsica Mist Ave, Las Vegas, NV 89135 and is currently estimated at $748,975, approximately $323 per square foot. 11186 Corsica Mist Ave is a home located in Clark County with nearby schools including Judy & John L. Goolsby Elementary School, Palo Verde High School, and The Alexander Dawson School at Rainbow Mountain.
Ownership History
Date
Name
Owned For
Owner Type
Purchase Details
Closed on
Jun 11, 2017
Sold by
Akianakos Achilles John and Wood Laura Lee
Bought by
Leontakianakos Achilles John and Wood Laura Lee
Current Estimated Value
Purchase Details
Closed on
Nov 29, 2010
Sold by
Toll South Lv Llc
Bought by
Leontakianakos Achilles John and Wood Laura Lee
Home Financials for this Owner
Home Financials are based on the most recent Mortgage that was taken out on this home.
Original Mortgage
$239,996
Outstanding Balance
$158,157
Interest Rate
4.17%
Mortgage Type
New Conventional
Estimated Equity
$590,818
Purchase Details
Closed on
Jan 23, 2008
Sold by
Toll Nv Holdings Llc
Bought by
Toll South Lv Llc
Create a Home Valuation Report for This Property
The Home Valuation Report is an in-depth analysis detailing your home's value as well as a comparison with similar homes in the area
Home Values in the Area
Average Home Value in this Area
Purchase History
| Date | Buyer | Sale Price | Title Company |
|---|---|---|---|
| Leontakianakos Achilles John | -- | None Available | |
| Leontakianakos Achilles John | $299,995 | First American Title Centra | |
| Toll South Lv Llc | -- | None Available | |
| Toll Nv Holdings Llc | -- | None Available |
Source: Public Records
Mortgage History
| Date | Status | Borrower | Loan Amount |
|---|---|---|---|
| Open | Leontakianakos Achilles John | $239,996 |
Source: Public Records
Tax History Compared to Growth
Tax History
| Year | Tax Paid | Tax Assessment Tax Assessment Total Assessment is a certain percentage of the fair market value that is determined by local assessors to be the total taxable value of land and additions on the property. | Land | Improvement |
|---|---|---|---|---|
| 2025 | $3,632 | $203,934 | $66,150 | $137,784 |
| 2024 | $3,527 | $203,934 | $66,150 | $137,784 |
| 2023 | $2,878 | $179,310 | $49,350 | $129,960 |
| 2022 | $3,424 | $157,904 | $39,900 | $118,004 |
| 2021 | $3,324 | $151,876 | $39,900 | $111,976 |
| 2020 | $3,224 | $147,640 | $36,750 | $110,890 |
| 2019 | $3,131 | $141,500 | $32,900 | $108,600 |
| 2018 | $3,075 | $132,887 | $28,700 | $104,187 |
| 2017 | $3,828 | $129,271 | $25,550 | $103,721 |
| 2016 | $2,878 | $120,227 | $21,000 | $99,227 |
| 2015 | $2,873 | $102,737 | $18,200 | $84,537 |
| 2014 | $2,789 | $90,985 | $11,550 | $79,435 |
Source: Public Records
Map
Nearby Homes
- 2334 Malaga Peak St
- 11239 Eureka Pass Ct
- 2374 Malaga Peak St
- 2043 Ardilea St
- 2031 Ardilea St
- 2435 Cordoba Bluff Ct
- 1885 Cape Cod Landing Dr
- 1837 Ardilea St
- 1871 Granemore St
- 2451 Hollow Rock Ct
- 2571 Red Springs Dr
- 11347 Belmont Lake Dr Unit 102
- 11420 Ogden Mills Dr Unit 101
- 2436 Grassy Spring Place
- 2486 Grassy Spring Place
- 2496 Grassy Spring Place
- 11422 Belmont Lake Dr Unit 104
- 1995 Alcova Ridge Dr
- 11428 Belmont Lake Dr Unit 102
- 11428 Belmont Lake Dr Unit 101
- 11194 Corsica Mist Ave
- 11190 Corsica Mist Ave
- 11190 Corsica Mist Ave
- 11190 Corsica Mist Ave
- 11198 Corsica Mist Ave
- 11202 Corsica Mist Ave
- 11202 Corsica Mist Ave
- 11202 Corsica Mist Ave Unit n/a
- 11182 Corsica Mist Ave
- 11218 Corsica Mist Ave
- 2180 Solvang Mill Dr
- 11206 Corsica Mist Ave
- 11220 Corsica Mist Ave
- 11214 Corsica Mist Ave
- 2168 Solvang Mill Dr
- 2169 Morro Vista Dr
- 11210 Corsica Mist Ave
- 2288 Malaga Peak St
- 2284 Malaga Peak St
- 2156 Solvang Mill Dr