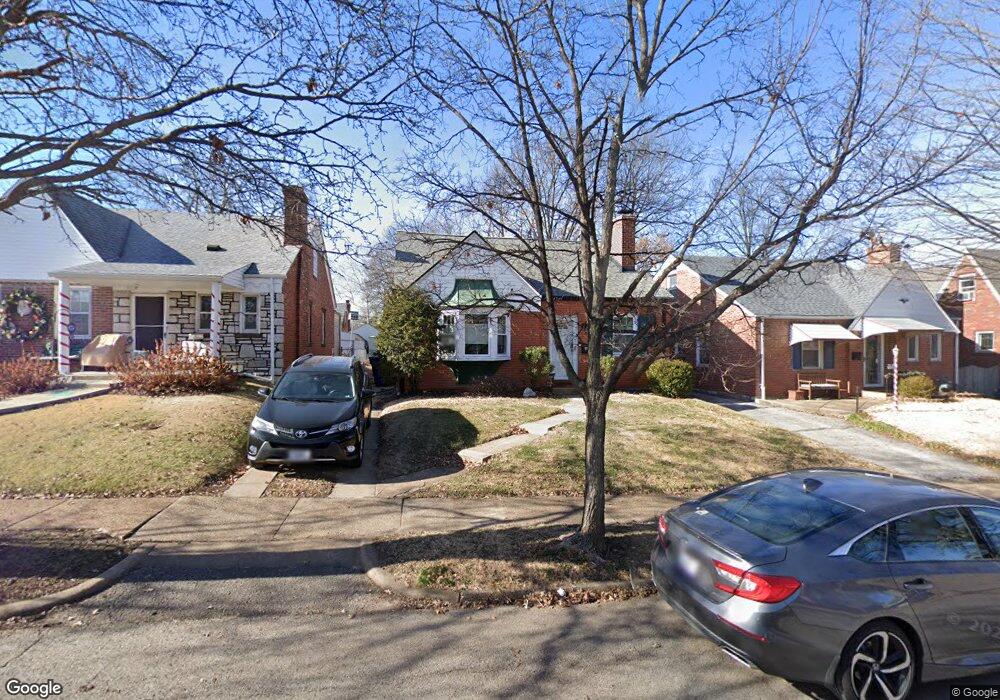
1119 Art Hill Place Saint Louis, MO 63139
Clayton-Tamm NeighborhoodEstimated Value: $261,598 - $397,000
--
Bed
1
Bath
2,040
Sq Ft
$152/Sq Ft
Est. Value
About This Home
This home is located at 1119 Art Hill Place, Saint Louis, MO 63139 and is currently estimated at $310,150, approximately $152 per square foot. 1119 Art Hill Place is a home located in St. Louis City with nearby schools including Mason Elementary School, Long International Middle School, and Roosevelt High School.
Ownership History
Date
Name
Owned For
Owner Type
Purchase Details
Closed on
Jan 5, 2021
Sold by
Chandler Samuel J and Mckee Deirdre E
Bought by
Chandler Samuel J and Mckee Deirdre E
Current Estimated Value
Purchase Details
Closed on
Nov 10, 2016
Sold by
Graham Timothy and Michelle Graham C
Bought by
Chandler Samuel J
Home Financials for this Owner
Home Financials are based on the most recent Mortgage that was taken out on this home.
Original Mortgage
$188,200
Outstanding Balance
$151,092
Interest Rate
3.42%
Mortgage Type
New Conventional
Estimated Equity
$159,058
Purchase Details
Closed on
Aug 10, 2006
Sold by
Bown Robert C
Bought by
Bown Robert C and The Florence Bown Revocable Trust
Home Financials for this Owner
Home Financials are based on the most recent Mortgage that was taken out on this home.
Original Mortgage
$132,000
Interest Rate
6.77%
Mortgage Type
Purchase Money Mortgage
Purchase Details
Closed on
Oct 30, 2003
Sold by
Bown Robert
Bought by
Bown Robert and Florence Bown Revocable Trust
Create a Home Valuation Report for This Property
The Home Valuation Report is an in-depth analysis detailing your home's value as well as a comparison with similar homes in the area
Home Values in the Area
Average Home Value in this Area
Purchase History
| Date | Buyer | Sale Price | Title Company |
|---|---|---|---|
| Chandler Samuel J | -- | Continental Title | |
| Chandler Samuel J | $199,250 | Ust | |
| Bown Robert C | -- | None Available | |
| Graham Timothy | -- | None Available | |
| Bown Robert | -- | -- | |
| Bown Robert C | -- | -- | |
| Bown Robert C | -- | -- |
Source: Public Records
Mortgage History
| Date | Status | Borrower | Loan Amount |
|---|---|---|---|
| Open | Chandler Samuel J | $188,200 | |
| Previous Owner | Graham Timothy | $132,000 |
Source: Public Records
Tax History Compared to Growth
Tax History
| Year | Tax Paid | Tax Assessment Tax Assessment Total Assessment is a certain percentage of the fair market value that is determined by local assessors to be the total taxable value of land and additions on the property. | Land | Improvement |
|---|---|---|---|---|
| 2025 | $2,921 | $41,490 | $3,040 | $38,450 |
| 2024 | $2,779 | $34,560 | $3,040 | $31,520 |
| 2023 | $2,779 | $34,560 | $3,040 | $31,520 |
| 2022 | $2,585 | $30,930 | $3,040 | $27,890 |
| 2021 | $2,581 | $30,930 | $3,040 | $27,890 |
| 2020 | $2,452 | $29,600 | $3,040 | $26,560 |
| 2019 | $2,444 | $29,600 | $3,040 | $26,560 |
| 2018 | $2,360 | $27,700 | $3,040 | $24,660 |
| 2017 | $2,320 | $27,700 | $3,040 | $24,660 |
| 2016 | $1,973 | $23,200 | $3,040 | $20,160 |
| 2015 | $1,789 | $23,200 | $3,040 | $20,160 |
| 2014 | $1,763 | $23,200 | $3,040 | $20,160 |
| 2013 | -- | $22,880 | $3,040 | $19,840 |
Source: Public Records
Map
Nearby Homes
- 1126 Art Hill Place
- 1031 Art Hill Place
- 6312 Berthold Ave
- 1320 Tamm Ave
- 6608 Oakland Ave
- 6614 Clayton Ave
- 6206 Victoria Ave
- 1324 Graham St
- 6614 Oakland Ave Unit A
- 1326 Graham St
- 6454 Wade Ave
- 1371 Mobile Ct
- 1361 Louisville Ave
- 1225 Kraft St
- 1348 Kraft St
- 1325 Hampton Ave
- 6719 Nashville Ave
- 6756 Dolan Place
- 6437 Brockschmidt Place
- 1511 Fairmount Ave
- 1115 Art Hill Place
- 1123 Art Hill Place
- 1127 Art Hill Place
- 1111 Art Hill Place
- 1118 Childress Ave
- 1131 Art Hill Place
- 1114 Childress Ave
- 1107 Art Hill Place
- 1122 Childress Ave
- 1110 Childress Ave
- 1126 Childress Ave
- 1118 Art Hill Place
- 1135 Art Hill Place
- 1122 Art Hill Place
- 1114 Art Hill Place
- 1101 Art Hill Place
- 1106 Childress Ave
- 1130 Childress Ave
- 1110 Art Hill Place
- 1102 Childress Ave