Estimated Value: $71,000 - $130,000
--
Bed
--
Bath
900
Sq Ft
$114/Sq Ft
Est. Value
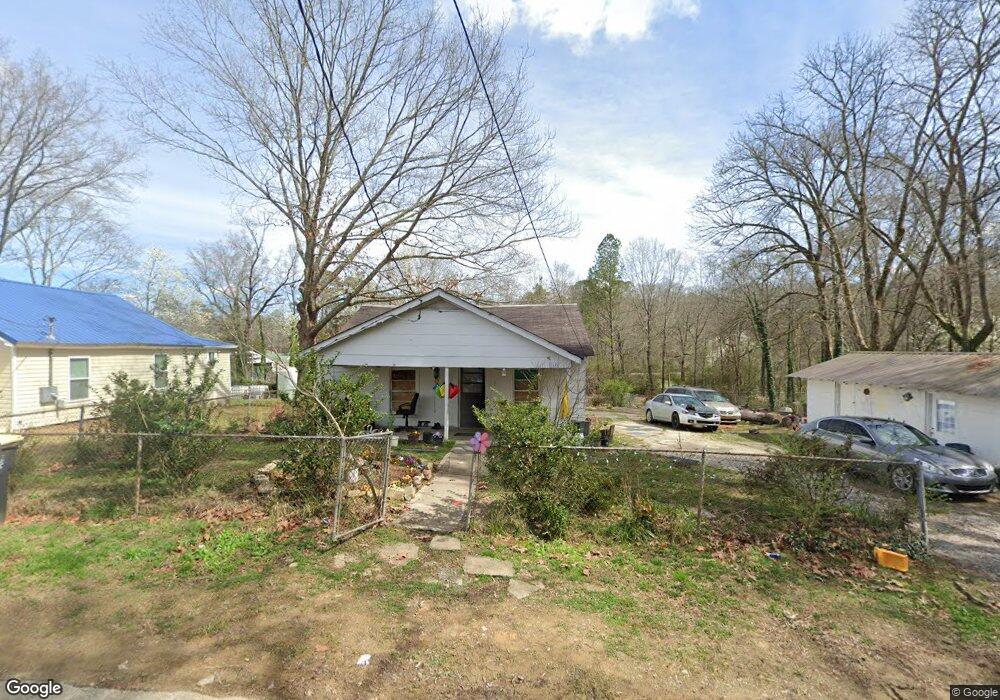
About This Home
This home is located at 112 Maryland Dr NW, Rome, GA 30165 and is currently estimated at $102,521, approximately $113 per square foot. 112 Maryland Dr NW is a home located in Floyd County with nearby schools including Rome High School and Darlington School.
Ownership History
Date
Name
Owned For
Owner Type
Purchase Details
Closed on
Apr 1, 2015
Sold by
Tate Melvin
Bought by
Tate Roger L
Current Estimated Value
Purchase Details
Closed on
Aug 15, 2001
Sold by
Tate Ray and Melvin Tate
Bought by
Tate Melvin and Brenda Tate
Purchase Details
Closed on
Jun 2, 1995
Sold by
Akins Buddie
Bought by
Tate Ray and Melvin Tate
Purchase Details
Closed on
Mar 30, 1973
Sold by
Administrator Of Veterans Affairs
Bought by
Akins Buddie
Purchase Details
Closed on
Jul 28, 1972
Sold by
Montgomery Jerry Wayne
Bought by
Administrator Of Veterans Affairs
Purchase Details
Closed on
Mar 12, 1971
Sold by
Atkins Mr and Mrs James C
Bought by
Montgomery Jerry Wayne
Purchase Details
Closed on
Jun 7, 1966
Sold by
Tucker Mrs Stephens
Bought by
Atkins Mr and Mrs James C
Purchase Details
Closed on
Jan 3, 1901
Sold by
Tucker Mrs Hattie
Bought by
Tucker Mrs Stephens
Purchase Details
Closed on
Jan 2, 1901
Sold by
Stephens M L
Bought by
Tucker Mrs Hattie
Purchase Details
Closed on
Jan 1, 1901
Bought by
Stephens M L
Create a Home Valuation Report for This Property
The Home Valuation Report is an in-depth analysis detailing your home's value as well as a comparison with similar homes in the area
Home Values in the Area
Average Home Value in this Area
Purchase History
| Date | Buyer | Sale Price | Title Company |
|---|---|---|---|
| Tate Roger L | -- | -- | |
| Tate Melvin | -- | -- | |
| Tate Ray | $20,000 | -- | |
| Akins Buddie | -- | -- | |
| Administrator Of Veterans Affairs | -- | -- | |
| Montgomery Jerry Wayne | $10,500 | -- | |
| Atkins Mr | $2,500 | -- | |
| Tucker Mrs Stephens | -- | -- | |
| Tucker Mrs Hattie | -- | -- | |
| Stephens M L | -- | -- |
Source: Public Records
Tax History Compared to Growth
Tax History
| Year | Tax Paid | Tax Assessment Tax Assessment Total Assessment is a certain percentage of the fair market value that is determined by local assessors to be the total taxable value of land and additions on the property. | Land | Improvement |
|---|---|---|---|---|
| 2024 | $775 | $19,793 | $9,328 | $10,465 |
| 2023 | $701 | $18,473 | $8,480 | $9,993 |
| 2022 | $617 | $16,903 | $6,784 | $10,119 |
| 2021 | $573 | $15,445 | $6,784 | $8,661 |
| 2020 | $503 | $13,437 | $5,300 | $8,137 |
| 2019 | $478 | $12,913 | $5,300 | $7,613 |
| 2018 | $456 | $12,308 | $5,300 | $7,008 |
| 2017 | $444 | $11,986 | $5,300 | $6,686 |
| 2016 | $437 | $11,756 | $5,280 | $6,476 |
| 2015 | $369 | $11,756 | $5,280 | $6,476 |
| 2014 | $369 | $11,756 | $5,280 | $6,476 |
Source: Public Records
Map
Nearby Homes
- 15 Alexander St
- 18 Butler Cir NW
- 100 Dellwood Dr NW
- 4 Homestead Cir NW
- 209 Larkspur Ln SW
- 214 N Elm St NW
- 16 Jefferson Dr SW
- 103 Wooten Dr SW
- 15 John Ross Dr SW
- 0 Cedartown Rd Unit 10479932
- 43 Westwood Cir SW
- 8 Leon St SW
- 40 Paris Dr SW
- 40 Westwood Cir SW
- 23 Sweetspire Dr NW
- 21 Sweetspire Dr NW
- 15 Silverbell Ln
- 114 Maryland Dr NW
- 311 Watson St NW
- 409 Woodbine Ave NW
- 118 Maryland Dr NW
- 313 Watson St NW
- 2 Garrard Ave NW
- 309 Watson St NW
- 113 Maryland Dr NW
- 115 Maryland Dr NW
- 303 Watson St NW
- 401 Woodbine Ave NW
- 401 Woodbine Ave NW
- 505 Woodbine Ave NW
- 301 Watson St NW
- 3 Garrard Ave NW
- 412 Woodbine Ave NW
- 414 Woodbine Ave NW
- 410 Woodbine Ave NW
- 406 Woodbine Ave NW
- 408 Woodbine Ave NW