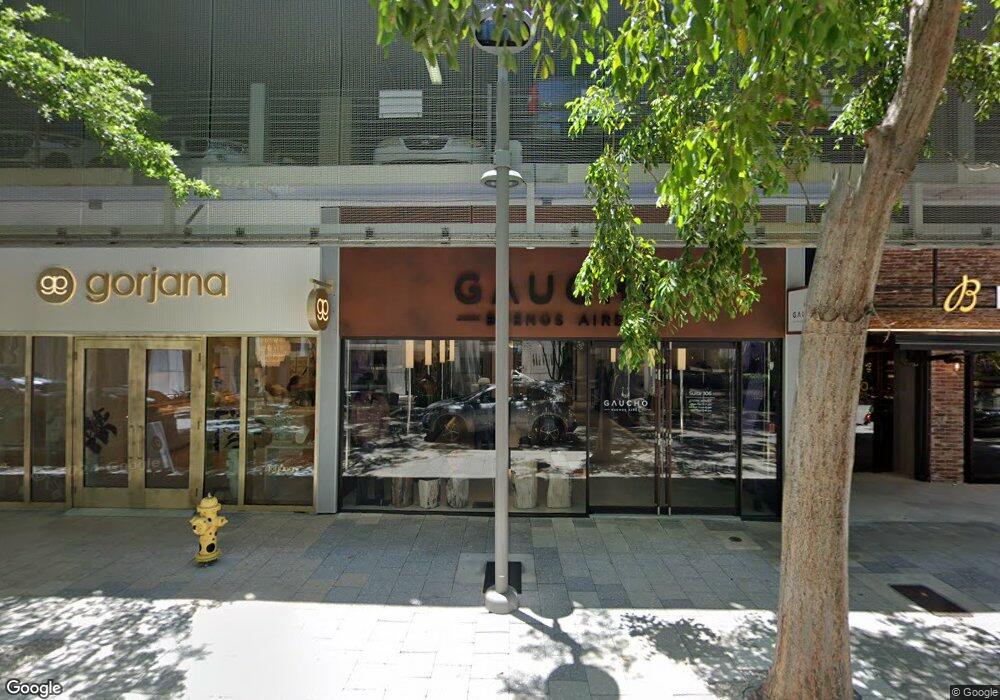
112 NE 41st St Miami, FL 33137
Miami Design District Neighborhood
--
Bed
4
Baths
84,748
Sq Ft
2,178
Sq Ft Lot
About This Home
This home is located at 112 NE 41st St, Miami, FL 33137. 112 NE 41st St is a home located in Miami-Dade County with nearby schools including Eneida M. Hartner Elementary School, Jose De Diego Middle School, and Booker T. Washington Senior High School.
Ownership History
Date
Name
Owned For
Owner Type
Purchase Details
Closed on
Feb 28, 2020
Sold by
Oak Plaza Associates Del Llc
Bought by
Paradise Plaza Associates Llc
Purchase Details
Closed on
Oct 16, 2006
Sold by
Gold Michael and Gold Lauren
Bought by
Bz 41 Llc
Home Financials for this Owner
Home Financials are based on the most recent Mortgage that was taken out on this home.
Original Mortgage
$810,000
Interest Rate
6.45%
Mortgage Type
Unknown
Purchase Details
Closed on
Jan 14, 1997
Sold by
Belair Michael G and Perez Sergio
Bought by
Gold Michael
Home Financials for this Owner
Home Financials are based on the most recent Mortgage that was taken out on this home.
Original Mortgage
$101,350
Interest Rate
7.53%
Mortgage Type
New Conventional
Purchase Details
Closed on
May 7, 1994
Sold by
Lasky Joseph and Lasky Jeanette
Bought by
Belair Michael
Home Financials for this Owner
Home Financials are based on the most recent Mortgage that was taken out on this home.
Original Mortgage
$15,000
Interest Rate
8.24%
Create a Home Valuation Report for This Property
The Home Valuation Report is an in-depth analysis detailing your home's value as well as a comparison with similar homes in the area
Home Values in the Area
Average Home Value in this Area
Purchase History
| Date | Buyer | Sale Price | Title Company |
|---|---|---|---|
| Paradise Plaza Associates Llc | -- | Attorney | |
| Bz 41 Llc | $1,080,000 | Attorney | |
| Gold Michael | $126,700 | -- | |
| Belair Michael | $43,000 | -- |
Source: Public Records
Mortgage History
| Date | Status | Borrower | Loan Amount |
|---|---|---|---|
| Previous Owner | Bz 41 Llc | $810,000 | |
| Previous Owner | Gold Michael | $101,350 | |
| Previous Owner | Belair Michael | $15,000 |
Source: Public Records
Tax History Compared to Growth
Tax History
| Year | Tax Paid | Tax Assessment Tax Assessment Total Assessment is a certain percentage of the fair market value that is determined by local assessors to be the total taxable value of land and additions on the property. | Land | Improvement |
|---|---|---|---|---|
| 2025 | $462,977 | $24,000,000 | $13,814,500 | $10,185,500 |
| 2024 | $466,129 | $23,110,500 | $13,025,100 | $10,085,400 |
| 2023 | $466,129 | $21,696,942 | $0 | $0 |
| 2022 | $412,107 | $19,724,493 | $0 | $0 |
| 2021 | $380,937 | $17,350,658 | $0 | $0 |
| 2020 | $311,953 | $14,646,985 | $7,894,000 | $6,752,985 |
| 2019 | $306,765 | $14,370,797 | $7,894,000 | $6,476,797 |
| 2018 | $243,657 | $15,087,924 | $7,894,000 | $7,193,924 |
| 2017 | $91,441 | $2,549,752 | $0 | $0 |
Source: Public Records
Map
Nearby Homes
- 151 NE 43rd St
- 46 NE 43rd St
- 38 NE 39th St
- 4848/4860 N Miami Ave
- 6050 N Miami Ave
- 231 NE 43rd St
- 2 NE 44th St
- 43 NW 41st St
- 261 NE 43rd St
- 135 NE 45th St
- 44 NW 40th St
- 3900 Biscayne Blvd Unit N-917
- 3900 Biscayne Blvd Unit S-904
- 3900 Biscayne Blvd Unit N-819
- 3900 Biscayne Blvd Unit S-1016
- 3900 Biscayne Blvd Unit 314
- 3900 Biscayne Blvd Unit S-616
- 3900 Biscayne Blvd Unit 1108
- 3900 Biscayne Blvd Unit S-1118
- 3900 Biscayne Blvd Unit N-805
- 120 NE 41st St
- 130 NE 41st St Unit 3
- 601 NE 1 Ne Ave Unit 4010
- 4010 NE 1st Ave Unit 4010
- Healthy Cafeteria Ba for Sale In Miami Design District
- 4100 NE 1st Ave
- 4135 NE 1st Ave
- 4112 NE 1st Ave
- 122 NE 42nd St
- 4120 NE 1st Ave
- 80 NE 42nd St
- 119 NE 39th St
- 80 NE 40th St
- 111 NE 42nd St
- 70 NE 42nd St
- 131 NE 42nd St
- 164 NE 41st St
- 70 NE 40th St
- 4200 NE 1st Ave Unit 4200
- 4200 NE 1st Ave Unit 4210