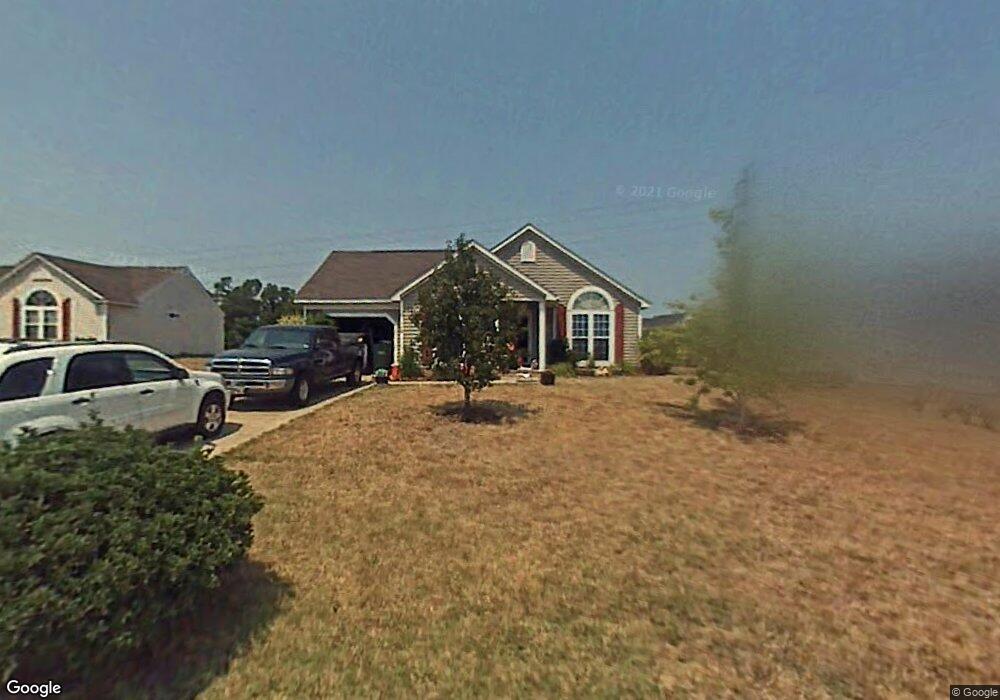
112 S Tanninger Rd Mount Holly, NC 28120
Estimated Value: $328,586 - $358,000
3
Beds
2
Baths
1,361
Sq Ft
$248/Sq Ft
Est. Value
About This Home
This home is located at 112 S Tanninger Rd, Mount Holly, NC 28120 and is currently estimated at $337,147, approximately $247 per square foot. 112 S Tanninger Rd is a home located in Gaston County with nearby schools including Pinewood Elementary School, Mount Holly Middle School, and Stuart W. Cramer High School.
Ownership History
Date
Name
Owned For
Owner Type
Purchase Details
Closed on
Oct 21, 2013
Sold by
Fisk Erika G and Fisk Dane Todd
Bought by
Singleton Steven D
Current Estimated Value
Home Financials for this Owner
Home Financials are based on the most recent Mortgage that was taken out on this home.
Original Mortgage
$116,100
Outstanding Balance
$87,511
Interest Rate
4.58%
Mortgage Type
New Conventional
Estimated Equity
$249,636
Purchase Details
Closed on
Sep 22, 2000
Sold by
Martin Charles Ray and Martin Erika Grindstaff
Bought by
Grindstaff Erika Dawn
Purchase Details
Closed on
Jan 30, 1998
Sold by
First Colony Group Ltd
Bought by
Martin Charles Ray and Martin Erika Grindstaff
Home Financials for this Owner
Home Financials are based on the most recent Mortgage that was taken out on this home.
Original Mortgage
$108,200
Interest Rate
7.07%
Mortgage Type
FHA
Create a Home Valuation Report for This Property
The Home Valuation Report is an in-depth analysis detailing your home's value as well as a comparison with similar homes in the area
Home Values in the Area
Average Home Value in this Area
Purchase History
| Date | Buyer | Sale Price | Title Company |
|---|---|---|---|
| Singleton Steven D | $129,000 | None Available | |
| Singleton Steven D | $129,000 | None Available | |
| Grindstaff Erika Dawn | -- | -- | |
| Martin Charles Ray | $109,500 | -- |
Source: Public Records
Mortgage History
| Date | Status | Borrower | Loan Amount |
|---|---|---|---|
| Open | Singleton Steven D | $116,100 | |
| Closed | Singleton Steven D | $116,100 | |
| Previous Owner | Martin Charles Ray | $108,200 |
Source: Public Records
Tax History Compared to Growth
Tax History
| Year | Tax Paid | Tax Assessment Tax Assessment Total Assessment is a certain percentage of the fair market value that is determined by local assessors to be the total taxable value of land and additions on the property. | Land | Improvement |
|---|---|---|---|---|
| 2025 | $3,056 | $304,370 | $32,500 | $271,870 |
| 2024 | $3,056 | $304,370 | $32,500 | $271,870 |
| 2023 | $3,089 | $304,370 | $32,500 | $271,870 |
| 2022 | $2,192 | $169,280 | $25,000 | $144,280 |
| 2021 | $2,226 | $169,280 | $25,000 | $144,280 |
| 2019 | $2,243 | $169,280 | $25,000 | $144,280 |
| 2018 | $1,756 | $125,446 | $19,200 | $106,246 |
| 2017 | $1,756 | $125,446 | $19,200 | $106,246 |
| 2016 | $1,091 | $125,446 | $0 | $0 |
| 2014 | $1,053 | $120,998 | $28,000 | $92,998 |
Source: Public Records
Map
Nearby Homes
- 105 S Tanninger Rd
- 504 N Hawthorne St
- 113 S Mulberry Ct
- 904 Timberlane Dr
- 157 Brookstone Dr
- 160 Brookstone Dr
- 1115 N Main St
- 103 Sadler Rd
- 101 Madison Dr
- 112 Julia St
- 201 1st St
- 433 W Central Ave
- 1601 N Main St
- 1604 N Main St
- 422 Wilson St
- 504 Stone River Pkwy
- 1015 Hoover Ave
- 307 Dogwood Dr
- 621 Herms Ave
- Winslow Plan at Mooreland Oaks
- 116 S Tanninger Rd
- 108 S Tanninger Rd
- 120 S Tanninger Rd
- 104 S Tanninger Rd
- 101 Silverleaf Rd
- 124 S Tanninger Rd
- 105 Silverleaf Rd
- 109 Lantana Dr
- 113 S Woodcliff Ln
- 105 Lantana Dr
- 113 S Tanninger Rd
- 109 S Woodcliff Ln
- 117 S Woodcliff Ln
- 109 S Tanninger Rd
- 105 S Woodcliff Ln
- 109 Silverleaf Rd
- 128 S Tanninger Rd
- 125 S Tanninger Rd
- 113 Lantana Dr
- 129 S Tanninger Rd