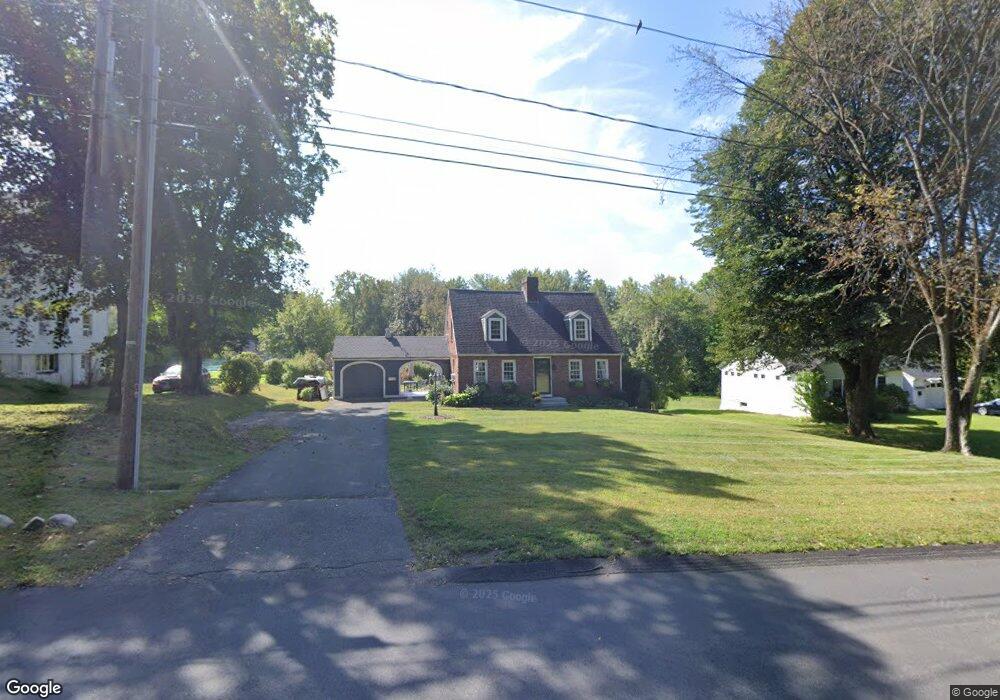
112 Silver St South Hadley, MA 01075
Estimated Value: $407,470 - $461,000
2
Beds
2
Baths
1,248
Sq Ft
$350/Sq Ft
Est. Value
About This Home
This home is located at 112 Silver St, South Hadley, MA 01075 and is currently estimated at $436,868, approximately $350 per square foot. 112 Silver St is a home located in Hampshire County with nearby schools including Plains Elementary School, Mosier Elementary School, and Michael E. Smith Middle School.
Ownership History
Date
Name
Owned For
Owner Type
Purchase Details
Closed on
Sep 2, 2008
Sold by
Diamond Christopher J and Hughes Hallie C
Bought by
Mccormick Laura K and Mccormick Thomas C
Current Estimated Value
Home Financials for this Owner
Home Financials are based on the most recent Mortgage that was taken out on this home.
Original Mortgage
$235,000
Interest Rate
6.29%
Mortgage Type
Purchase Money Mortgage
Purchase Details
Closed on
Jul 25, 2003
Sold by
Potter Adaline S Pates
Bought by
Diamond Christopher J and Hughes Hallie C
Home Financials for this Owner
Home Financials are based on the most recent Mortgage that was taken out on this home.
Original Mortgage
$210,000
Interest Rate
5.27%
Mortgage Type
Purchase Money Mortgage
Create a Home Valuation Report for This Property
The Home Valuation Report is an in-depth analysis detailing your home's value as well as a comparison with similar homes in the area
Home Values in the Area
Average Home Value in this Area
Purchase History
| Date | Buyer | Sale Price | Title Company |
|---|---|---|---|
| Mccormick Laura K | $260,000 | -- | |
| Diamond Christopher J | $237,500 | -- |
Source: Public Records
Mortgage History
| Date | Status | Borrower | Loan Amount |
|---|---|---|---|
| Open | Diamond Christopher J | $231,000 | |
| Closed | Mccormick Laura K | $235,000 | |
| Previous Owner | Diamond Christopher J | $50,000 | |
| Previous Owner | Diamond Christopher J | $36,500 | |
| Previous Owner | Diamond Christopher J | $210,000 |
Source: Public Records
Tax History Compared to Growth
Tax History
| Year | Tax Paid | Tax Assessment Tax Assessment Total Assessment is a certain percentage of the fair market value that is determined by local assessors to be the total taxable value of land and additions on the property. | Land | Improvement |
|---|---|---|---|---|
| 2025 | $5,876 | $362,500 | $150,300 | $212,200 |
| 2024 | $5,599 | $337,500 | $140,200 | $197,300 |
| 2023 | $5,388 | $303,200 | $127,500 | $175,700 |
| 2022 | $5,284 | $278,400 | $127,500 | $150,900 |
| 2021 | $14,604 | $260,300 | $119,300 | $141,000 |
| 2020 | $5,093 | $250,400 | $119,300 | $131,100 |
| 2019 | $4,963 | $241,500 | $114,000 | $127,500 |
| 2018 | $4,791 | $234,600 | $110,600 | $124,000 |
| 2017 | $4,663 | $225,700 | $110,600 | $115,100 |
| 2016 | $4,866 | $237,500 | $101,400 | $136,100 |
| 2015 | $4,672 | $230,600 | $98,400 | $132,200 |
Source: Public Records
Map
Nearby Homes
- 121 Cold Hill Rd
- 31 College View Heights
- 41 Woodbridge St
- 17 Woodbridge St
- 289 Morgan St
- 73 Amherst St
- 115 Woodbridge St
- 55 Pleasant St Unit 4
- 18 Smith Ave
- 96 College St
- 108 College St
- 200 East St
- 12-r Jackielyn Cir
- 586 Granby Rd
- 150 Pearl St
- 2 Skinnerwoods Way Unit 2
- 3 Miller Ave
- 113 Pearl St
- 125 Pearl St
- 540 Granby Rd Unit 72A