Estimated Value: $755,000 - $1,167,000
4
Beds
4
Baths
3,496
Sq Ft
$263/Sq Ft
Est. Value
About This Home
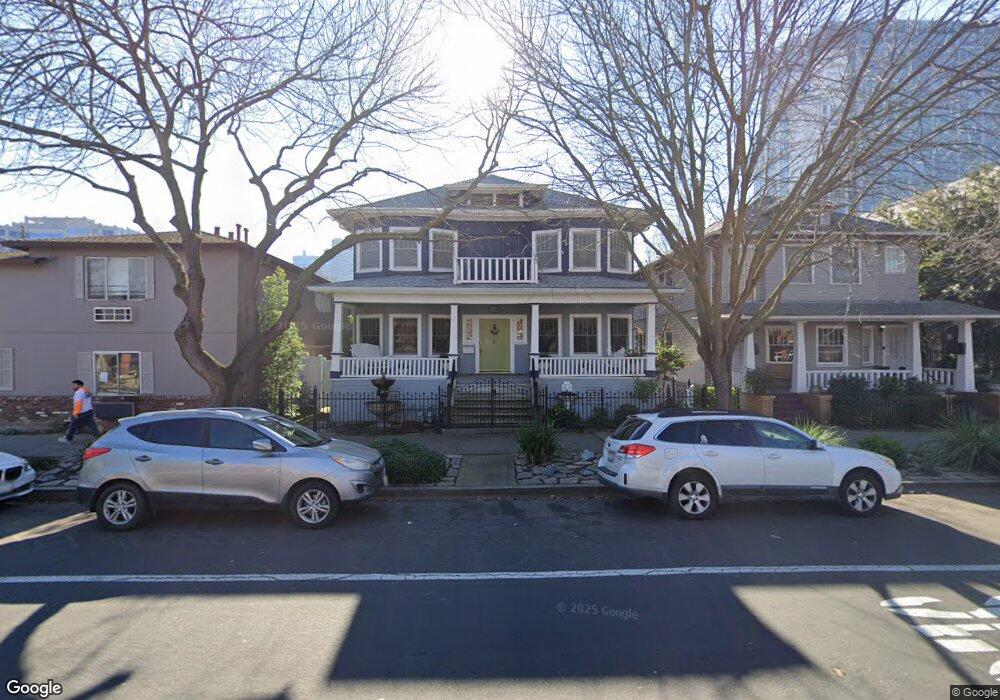
This home is located at 1120 G St, Sacramento, CA 95814 and is currently estimated at $918,245, approximately $262 per square foot. 1120 G St is a home located in Sacramento County with nearby schools including Washington Elementary, Miwok Middle School, and C. K. McClatchy High.
Ownership History
Date
Name
Owned For
Owner Type
Purchase Details
Closed on
Sep 30, 2025
Sold by
Cunningham Virginia L
Bought by
Phillip M Cunningham M and Phillip Virginia L
Current Estimated Value
Purchase Details
Closed on
Dec 17, 2019
Sold by
Monighan Bruce A
Bought by
Cunningham Phillip M and Cunningham Virginia L
Purchase Details
Closed on
Dec 20, 2012
Sold by
Cunningham Phillip and Monighan Bruce A
Bought by
Monighan Bruce A and Cunningham Phillip M
Home Financials for this Owner
Home Financials are based on the most recent Mortgage that was taken out on this home.
Original Mortgage
$210,000
Interest Rate
3.27%
Mortgage Type
New Conventional
Create a Home Valuation Report for This Property
The Home Valuation Report is an in-depth analysis detailing your home's value as well as a comparison with similar homes in the area
Home Values in the Area
Average Home Value in this Area
Purchase History
| Date | Buyer | Sale Price | Title Company |
|---|---|---|---|
| Phillip M Cunningham M | -- | None Listed On Document | |
| Cunningham Virginia L | -- | None Listed On Document | |
| Cunningham Phillip M | -- | None Available | |
| Cunningham Phillip M | -- | None Available | |
| Monighan Bruce A | -- | Chicago Title Company | |
| Monighan Bruce A | -- | Chicago Title Company | |
| Cunningham Phillip | -- | Chicago Title Company | |
| Cunningham Phillip | -- | Chicago Title Company |
Source: Public Records
Mortgage History
| Date | Status | Borrower | Loan Amount |
|---|---|---|---|
| Previous Owner | Cunningham Phillip | $210,000 |
Source: Public Records
Tax History Compared to Growth
Tax History
| Year | Tax Paid | Tax Assessment Tax Assessment Total Assessment is a certain percentage of the fair market value that is determined by local assessors to be the total taxable value of land and additions on the property. | Land | Improvement |
|---|---|---|---|---|
| 2025 | $7,905 | $667,622 | $255,853 | $411,769 |
| 2024 | $7,905 | $654,533 | $250,837 | $403,696 |
| 2023 | $7,890 | $641,700 | $245,919 | $395,781 |
| 2022 | $7,755 | $629,119 | $241,098 | $388,021 |
| 2021 | $7,394 | $616,784 | $236,371 | $380,413 |
| 2020 | $7,464 | $610,461 | $233,948 | $376,513 |
| 2019 | $3,309 | $233,708 | $129,941 | $103,767 |
| 2018 | $3,225 | $229,127 | $127,394 | $101,733 |
| 2017 | $3,179 | $224,636 | $124,897 | $99,739 |
| 2016 | $3,001 | $220,233 | $122,449 | $97,784 |
| 2015 | $2,955 | $216,926 | $120,610 | $96,316 |
| 2014 | $2,885 | $373,355 | $206,013 | $167,342 |
Source: Public Records
Map
Nearby Homes