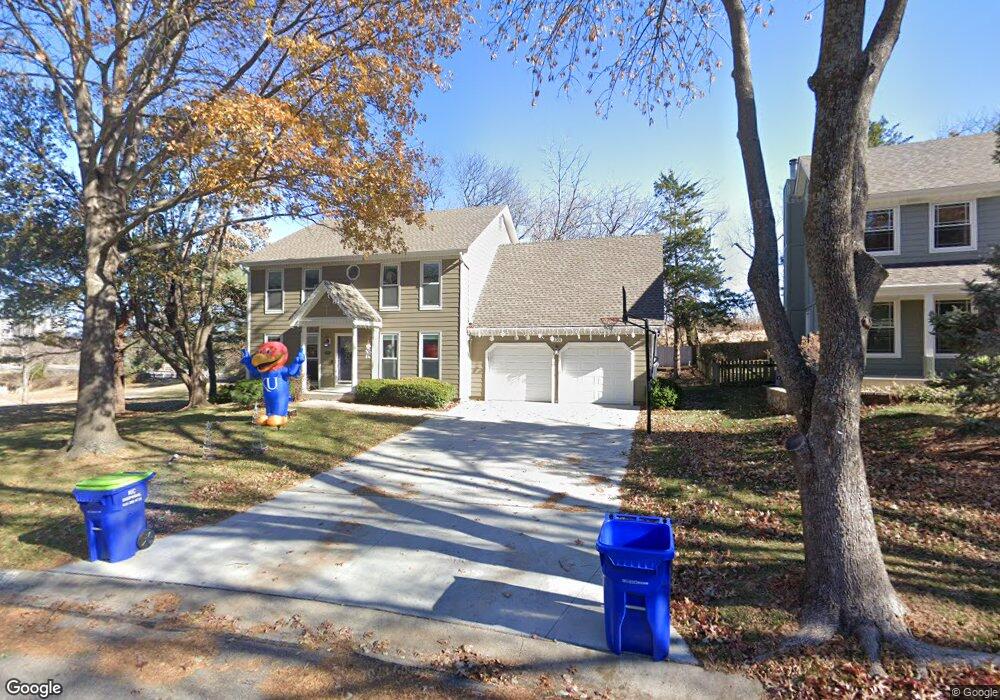
11201 Marty St Overland Park, KS 66210
Central Overland Park NeighborhoodEstimated Value: $456,000 - $476,000
4
Beds
3
Baths
2,373
Sq Ft
$194/Sq Ft
Est. Value
About This Home
This home is located at 11201 Marty St, Overland Park, KS 66210 and is currently estimated at $461,461, approximately $194 per square foot. 11201 Marty St is a home located in Johnson County with nearby schools including Valley Park Elementary School, Overland Trail Middle School, and Blue Valley North High School.
Ownership History
Date
Name
Owned For
Owner Type
Purchase Details
Closed on
Jun 15, 2001
Sold by
Blanck Kristi L and Blanck Thomas M
Bought by
Blanck Thomas M and Blanck Kristi L
Current Estimated Value
Home Financials for this Owner
Home Financials are based on the most recent Mortgage that was taken out on this home.
Original Mortgage
$110,000
Interest Rate
6.6%
Purchase Details
Closed on
Jan 6, 1997
Sold by
Zieman Gregory Mark
Bought by
Zieman Kristi Lou
Create a Home Valuation Report for This Property
The Home Valuation Report is an in-depth analysis detailing your home's value as well as a comparison with similar homes in the area
Home Values in the Area
Average Home Value in this Area
Purchase History
| Date | Buyer | Sale Price | Title Company |
|---|---|---|---|
| Blanck Thomas M | -- | Security Land Title Company | |
| Zieman Kristi Lou | -- | Security Land Title Company |
Source: Public Records
Mortgage History
| Date | Status | Borrower | Loan Amount |
|---|---|---|---|
| Closed | Blanck Thomas M | $110,000 |
Source: Public Records
Tax History Compared to Growth
Tax History
| Year | Tax Paid | Tax Assessment Tax Assessment Total Assessment is a certain percentage of the fair market value that is determined by local assessors to be the total taxable value of land and additions on the property. | Land | Improvement |
|---|---|---|---|---|
| 2024 | $4,727 | $46,391 | $10,924 | $35,467 |
| 2023 | $4,581 | $44,080 | $10,924 | $33,156 |
| 2022 | $4,099 | $38,778 | $10,924 | $27,854 |
| 2021 | $4,082 | $36,559 | $8,094 | $28,465 |
| 2020 | $4,029 | $35,845 | $7,362 | $28,483 |
| 2019 | $3,983 | $34,684 | $4,904 | $29,780 |
| 2018 | $3,748 | $31,993 | $4,904 | $27,089 |
| 2017 | $3,583 | $30,061 | $4,904 | $25,157 |
| 2016 | $3,267 | $27,393 | $4,904 | $22,489 |
| 2015 | $3,214 | $26,853 | $4,904 | $21,949 |
| 2013 | -- | $24,484 | $4,904 | $19,580 |
Source: Public Records
Map
Nearby Homes
- 11309 Riley St
- 11422 Conser St
- 11504 Newton St
- 11447 Craig St
- 11316 Hemlock St
- 6735 W 108th Terrace
- 8500 W 113th St
- 7861 W 118th Terrace
- 11721 Craig St
- 8712 W 113th St
- 8280 W 117th St
- 11163 Eby St
- 11838 Mackey St
- 11404 Grandview Dr
- 8313 W 120th St
- 12031 Hemlock St
- 8819 W 106th Terrace
- 11739 Grant St
- 8858 W 106th Terrace
- 7402 W 102nd Ct
- 11205 Marty St
- 11209 Marty St
- 7301 W 112th St
- 11204 Marty St
- 11213 Marty St
- 7305 W 112th St
- 11208 Marty St
- 11217 Marty St
- 11212 Marty St
- 11209 Riley St
- 11213 Riley St
- 11221 Marty St
- 11205 Riley St
- 11217 Riley St
- 11216 Marty St
- 11301 Riley St
- 7313 W 112th St
- 11301 Marty St
- 11300 Marty St
- 11305 Riley St