Estimated Value: $327,819 - $357,000
3
Beds
2
Baths
1,904
Sq Ft
$179/Sq Ft
Est. Value
About This Home
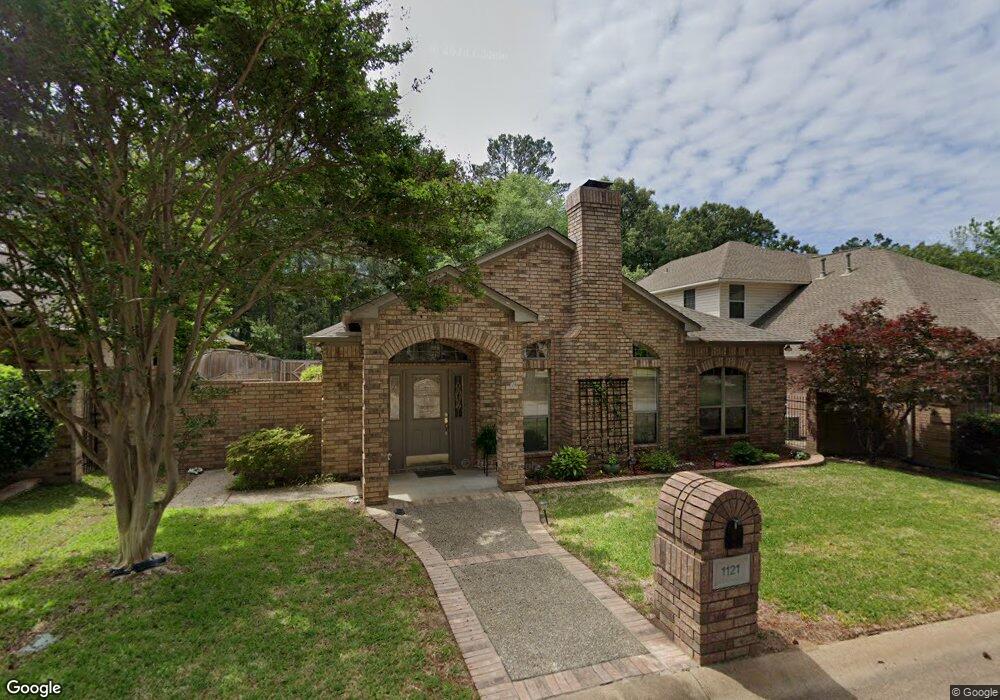
This home is located at 1121 Garden Park Cir, Tyler, TX 75703 and is currently estimated at $341,205, approximately $179 per square foot. 1121 Garden Park Cir is a home located in Smith County with nearby schools including Mozelle Brown Elementary School, J.W. Holloway Sixth Grade School, and Whitehouse High School.
Ownership History
Date
Name
Owned For
Owner Type
Purchase Details
Closed on
Aug 3, 2022
Sold by
Steve And Carol Conway Revocable Trust
Bought by
Sjovall John M
Current Estimated Value
Home Financials for this Owner
Home Financials are based on the most recent Mortgage that was taken out on this home.
Original Mortgage
$200,000
Outstanding Balance
$190,481
Interest Rate
5.38%
Mortgage Type
New Conventional
Estimated Equity
$150,724
Purchase Details
Closed on
May 19, 2021
Sold by
Conway Stephen P and Conway Carol Ann
Bought by
Steve And Carol Conway Revocable Trust
Purchase Details
Closed on
Sep 17, 2020
Sold by
Mathis Janie J
Bought by
Conway Stephen P and Conway Carol Ann
Home Financials for this Owner
Home Financials are based on the most recent Mortgage that was taken out on this home.
Original Mortgage
$200,000
Interest Rate
2%
Mortgage Type
New Conventional
Create a Home Valuation Report for This Property
The Home Valuation Report is an in-depth analysis detailing your home's value as well as a comparison with similar homes in the area
Home Values in the Area
Average Home Value in this Area
Purchase History
| Date | Buyer | Sale Price | Title Company |
|---|---|---|---|
| Sjovall John M | -- | New Title Company Name | |
| Steve And Carol Conway Revocable Trust | -- | None Available | |
| Conway Stephen P | -- | None Available |
Source: Public Records
Mortgage History
| Date | Status | Borrower | Loan Amount |
|---|---|---|---|
| Open | Sjovall John M | $200,000 | |
| Previous Owner | Conway Stephen P | $200,000 | |
| Closed | Steve And Carol Conway Revocable Trust | $0 |
Source: Public Records
Tax History Compared to Growth
Tax History
| Year | Tax Paid | Tax Assessment Tax Assessment Total Assessment is a certain percentage of the fair market value that is determined by local assessors to be the total taxable value of land and additions on the property. | Land | Improvement |
|---|---|---|---|---|
| 2025 | $3,638 | $403,158 | $40,045 | $363,113 |
| 2024 | $3,638 | $417,716 | $50,750 | $366,966 |
| 2023 | $4,890 | $321,236 | $50,750 | $270,486 |
| 2022 | $4,695 | $269,130 | $43,500 | $225,630 |
| 2021 | $4,681 | $250,510 | $43,500 | $207,010 |
| 2020 | $4,723 | $244,708 | $43,500 | $201,208 |
| 2019 | $5,352 | $230,976 | $36,250 | $194,726 |
| 2018 | $4,424 | $223,079 | $36,250 | $186,829 |
| 2017 | $3,911 | $223,079 | $36,250 | $186,829 |
| 2016 | $3,718 | $212,079 | $36,250 | $175,829 |
| 2015 | $3,312 | $206,240 | $36,250 | $169,990 |
| 2014 | $3,312 | $202,835 | $36,250 | $166,585 |
Source: Public Records
Map
Nearby Homes
- 1149 Garden Park Cir
- 1157 Garden Park Cir
- 1103 Laurelwood Dr
- 1173 Garden Park Cir
- 5721 Fern Cove Terrace
- 5709 Fern Cove Terrace
- 1137 Gardenwood Dr
- 1133 Gardenwood Dr
- 5620 Copper Park
- 1857 Stonecrest Blvd
- 1792 Stonecrest Blvd
- 5789 New Copeland Rd
- 5783 New Copeland Rd
- 5133 Avenham Ct
- 5219 Stagecoach St
- 5112 Timber Creek Dr
- 5117 Stagecoach Dr
- 5117 Stagecoach St
- 5104 Kingspark Cir
- 1940 Stonehill Dr
- 1125 Garden Park Cir
- 1117 Garden Park Cir
- 1129 Garden Park Cir
- 1129 1129 Garden Park Cir
- 1113 Garden Park Cir
- 1126 Garden Park Cir
- 1133 Garden Park Cir
- 1130 Garden Park Cir
- 1130 1130 Garden Park Cr
- 1105 Garden Park Cir
- 1101 Garden Park Cir
- 1137 1137 Garden Park Cir
- 1137 Garden Park Cir
- 1146 Garden Park Cir
- 1104 Oak Garden Cir
- 1141 Garden Park Cir
- 1108 1108 Oak Garden Cir
- 1108 Oak Garden Cir
- 1158 Garden Park Cir
- 1145 Garden Park Cir