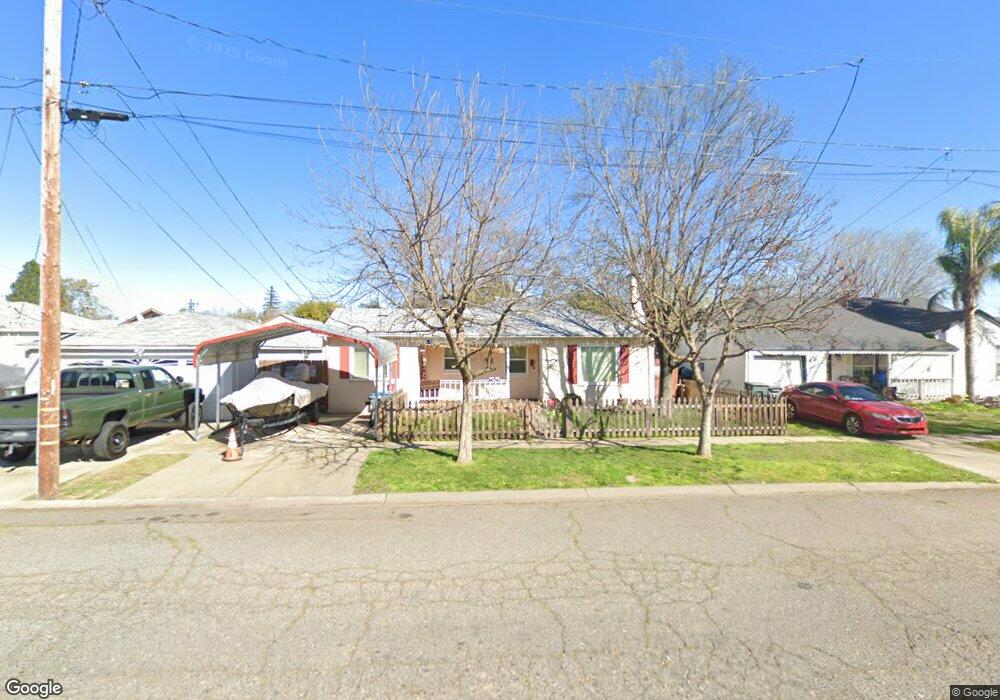
1123 Swezy St Marysville, CA 95901
Estimated Value: $87,000 - $283,000
2
Beds
1
Bath
1,001
Sq Ft
$196/Sq Ft
Est. Value
About This Home
This home is located at 1123 Swezy St, Marysville, CA 95901 and is currently estimated at $196,004, approximately $195 per square foot. 1123 Swezy St is a home located in Yuba County with nearby schools including Kynoch Elementary School, Anna McKenney Intermediate, and Marysville High School.
Ownership History
Date
Name
Owned For
Owner Type
Purchase Details
Closed on
Apr 6, 2013
Sold by
Jackson Palvinder K
Bought by
Jackson Palvinder K
Current Estimated Value
Home Financials for this Owner
Home Financials are based on the most recent Mortgage that was taken out on this home.
Original Mortgage
$41,514
Outstanding Balance
$8,784
Interest Rate
3.5%
Mortgage Type
FHA
Estimated Equity
$187,220
Purchase Details
Closed on
Dec 8, 2010
Sold by
Brown Mary Ann
Bought by
Jackson Palvinder K
Purchase Details
Closed on
Mar 26, 2003
Sold by
Stam Marianne
Bought by
Stam Marianne
Create a Home Valuation Report for This Property
The Home Valuation Report is an in-depth analysis detailing your home's value as well as a comparison with similar homes in the area
Home Values in the Area
Average Home Value in this Area
Purchase History
| Date | Buyer | Sale Price | Title Company |
|---|---|---|---|
| Jackson Palvinder K | -- | Lsi | |
| Jackson Palvinder K | $75,000 | Placer Title Company | |
| Stam Marianne | -- | North State Title Co |
Source: Public Records
Mortgage History
| Date | Status | Borrower | Loan Amount |
|---|---|---|---|
| Open | Jackson Palvinder K | $41,514 |
Source: Public Records
Tax History Compared to Growth
Tax History
| Year | Tax Paid | Tax Assessment Tax Assessment Total Assessment is a certain percentage of the fair market value that is determined by local assessors to be the total taxable value of land and additions on the property. | Land | Improvement |
|---|---|---|---|---|
| 2025 | $1,064 | $96,075 | $25,617 | $70,458 |
| 2023 | $1,064 | $92,346 | $24,623 | $67,723 |
| 2022 | $1,028 | $90,537 | $24,141 | $66,396 |
| 2021 | $1,014 | $88,763 | $23,668 | $65,095 |
| 2020 | $1,005 | $87,854 | $23,426 | $64,428 |
| 2019 | $984 | $86,132 | $22,967 | $63,165 |
| 2018 | $964 | $84,444 | $22,517 | $61,927 |
| 2017 | $934 | $82,789 | $22,076 | $60,713 |
| 2016 | $926 | $81,167 | $21,644 | $59,523 |
| 2015 | $906 | $79,948 | $21,319 | $58,629 |
| 2014 | $891 | $78,383 | $20,902 | $57,481 |
Source: Public Records
Map
Nearby Homes