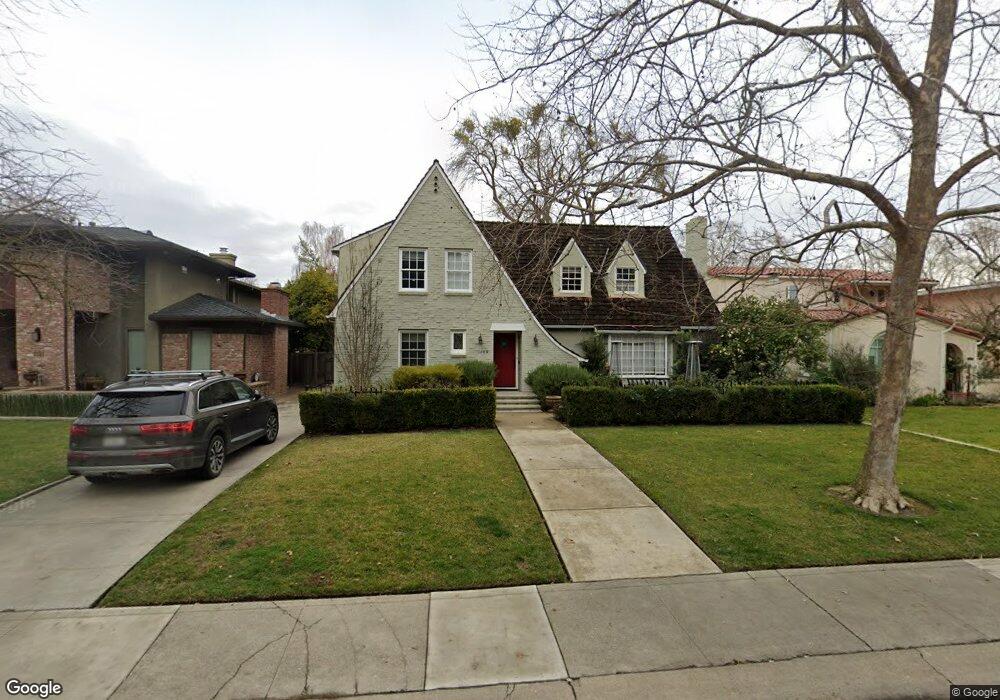
1125 11th Ave Sacramento, CA 95818
Land Park NeighborhoodEstimated Value: $1,575,000 - $1,814,785
4
Beds
3
Baths
4,226
Sq Ft
$398/Sq Ft
Est. Value
About This Home
This home is located at 1125 11th Ave, Sacramento, CA 95818 and is currently estimated at $1,682,595, approximately $398 per square foot. 1125 11th Ave is a home located in Sacramento County with nearby schools including Crocker/Riverside Elementary School, California Middle, and C. K. McClatchy High.
Ownership History
Date
Name
Owned For
Owner Type
Purchase Details
Closed on
Apr 30, 2025
Sold by
Rogers Suzanne Elizabeth
Bought by
Suzanne E Rogers Revocable Trust and Rogers
Current Estimated Value
Purchase Details
Closed on
Jan 31, 2025
Sold by
Plant And Rogers Family Trust and Plant Brian Johnston
Bought by
Rogers Suzanne Elizabeth
Purchase Details
Closed on
May 25, 2001
Sold by
Rogers Suzanne E and Plant Brian J
Bought by
Plant Brian Johnston and Rogers Suzanne Elizabeth
Purchase Details
Closed on
Mar 15, 2000
Sold by
Dorothey Parker & Tr Parker Family 1987 Tr &
Bought by
Plant Brian J and Rogers Suzanne E
Home Financials for this Owner
Home Financials are based on the most recent Mortgage that was taken out on this home.
Original Mortgage
$315,000
Interest Rate
8.38%
Create a Home Valuation Report for This Property
The Home Valuation Report is an in-depth analysis detailing your home's value as well as a comparison with similar homes in the area
Home Values in the Area
Average Home Value in this Area
Purchase History
| Date | Buyer | Sale Price | Title Company |
|---|---|---|---|
| Suzanne E Rogers Revocable Trust | -- | None Listed On Document | |
| Suzanne E Rogers Revocable Trust | -- | None Listed On Document | |
| Rogers Suzanne Elizabeth | -- | None Listed On Document | |
| Rogers Suzanne Elizabeth | -- | None Listed On Document | |
| Plant Brian Johnston | -- | -- | |
| Plant Brian J | $525,000 | Stewart Title |
Source: Public Records
Mortgage History
| Date | Status | Borrower | Loan Amount |
|---|---|---|---|
| Previous Owner | Plant Brian J | $315,000 |
Source: Public Records
Tax History Compared to Growth
Tax History
| Year | Tax Paid | Tax Assessment Tax Assessment Total Assessment is a certain percentage of the fair market value that is determined by local assessors to be the total taxable value of land and additions on the property. | Land | Improvement |
|---|---|---|---|---|
| 2025 | $12,282 | $1,043,814 | $230,533 | $813,281 |
| 2024 | $12,282 | $1,023,348 | $226,013 | $797,335 |
| 2023 | $11,996 | $1,003,283 | $221,582 | $781,701 |
| 2022 | $11,797 | $983,612 | $217,238 | $766,374 |
| 2021 | $11,240 | $964,327 | $212,979 | $751,348 |
| 2020 | $11,339 | $954,440 | $210,796 | $743,644 |
| 2019 | $11,098 | $935,726 | $206,663 | $729,063 |
| 2018 | $10,812 | $917,379 | $202,611 | $714,768 |
| 2017 | $10,668 | $899,392 | $198,639 | $700,753 |
| 2016 | $10,335 | $874,405 | $194,745 | $679,660 |
| 2015 | $10,142 | $861,271 | $191,820 | $669,451 |
| 2014 | $9,865 | $844,401 | $188,063 | $656,338 |
Source: Public Records
Map
Nearby Homes
- 1032 10th Ave
- 1432 Teneighth Way
- 849 8th Ave
- 3098 Riverside Blvd
- 710 7th Ave
- 1701 9th Ave
- 625 Robertson Way
- 2750 Moonflower St
- 2825 Elderberry St
- 2726 Moonflower St
- The Argo Plan at The Estates at Newport
- The Baltic Plan at The Estates at Newport
- The Caspian Plan at The Estates at Newport
- The Dawson Plan at The Estates at Newport
- 1831 9th Ave
- 613 Swanston Dr
- 749 3rd Ave Unit 3
- 1615 Vallejo Way
- 808 Fremont Way
- 1725 Vallejo Way