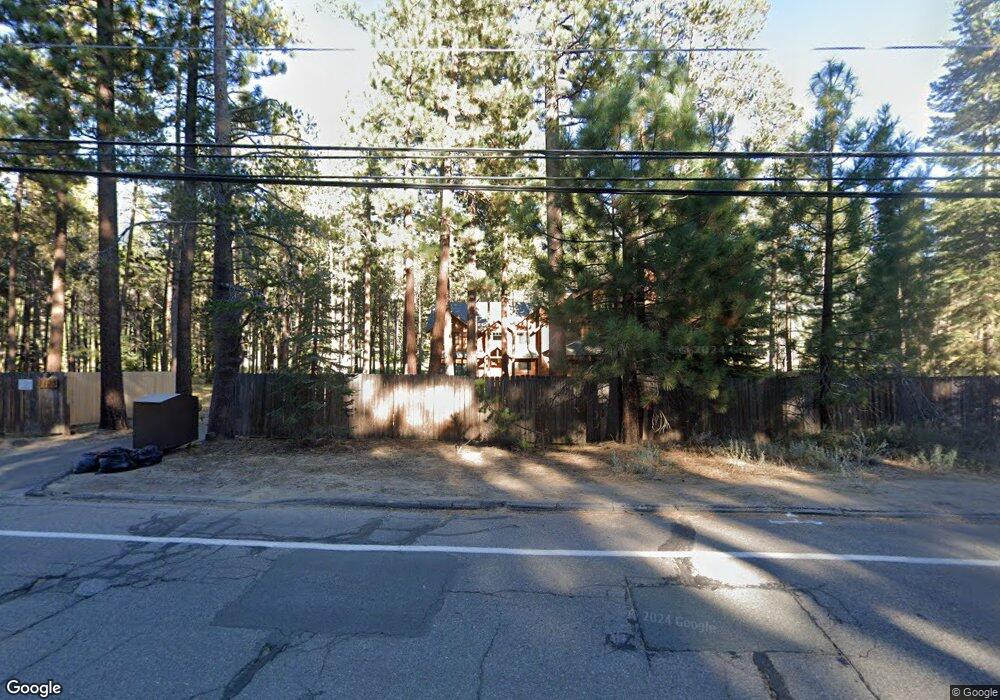
1125 Johnson Blvd South Lake Tahoe, CA 96150
Estimated Value: $1,019,000 - $1,294,543
4
Beds
3
Baths
2,951
Sq Ft
$404/Sq Ft
Est. Value
About This Home
This home is located at 1125 Johnson Blvd, South Lake Tahoe, CA 96150 and is currently estimated at $1,191,636, approximately $403 per square foot. 1125 Johnson Blvd is a home located in El Dorado County with nearby schools including Bijou Community, South Tahoe Middle School, and South Tahoe High School.
Ownership History
Date
Name
Owned For
Owner Type
Purchase Details
Closed on
Jan 23, 2025
Sold by
Faber Michael Kenneth
Bought by
Faber Family Trust and Faber
Current Estimated Value
Purchase Details
Closed on
May 18, 2000
Sold by
Langstaff Kenneth H Tr and Langstaff Theresa A Tr Etal
Bought by
Faber Michael Kenneth
Purchase Details
Closed on
May 11, 2000
Sold by
Whitaker Robert B and Whitaker Rose M
Bought by
Whitaker Robert B
Purchase Details
Closed on
Mar 29, 2000
Sold by
Colangelo Patricia
Bought by
Colangelo Morris
Purchase Details
Closed on
Jul 22, 1998
Sold by
Langstaff Kenneth H and Langstaff Theresa A
Bought by
Langstaff Kenneth H and Langstaff Theresa A
Purchase Details
Closed on
Dec 11, 1997
Sold by
Whitaker Robert B and Whitaker Rose M
Bought by
Whitaker Robert B and Whitaker Rose M
Create a Home Valuation Report for This Property
The Home Valuation Report is an in-depth analysis detailing your home's value as well as a comparison with similar homes in the area
Home Values in the Area
Average Home Value in this Area
Purchase History
| Date | Buyer | Sale Price | Title Company |
|---|---|---|---|
| Faber Family Trust | -- | None Listed On Document | |
| Faber Michael Kenneth | $57,000 | Fidelity National Title Co | |
| Whitaker Robert B | -- | -- | |
| Colangelo Morris | -- | Fidelity National Title Co | |
| Langstaff Kenneth H | -- | -- | |
| Whitaker Robert B | -- | -- |
Source: Public Records
Tax History Compared to Growth
Tax History
| Year | Tax Paid | Tax Assessment Tax Assessment Total Assessment is a certain percentage of the fair market value that is determined by local assessors to be the total taxable value of land and additions on the property. | Land | Improvement |
|---|---|---|---|---|
| 2025 | $9,208 | $878,158 | $87,588 | $790,570 |
| 2024 | $9,208 | $860,940 | $85,871 | $775,069 |
| 2023 | $9,047 | $844,060 | $84,188 | $759,872 |
| 2022 | $8,958 | $827,511 | $82,538 | $744,973 |
| 2021 | $8,880 | $816,916 | $80,920 | $735,996 |
| 2020 | $8,814 | $814,468 | $80,091 | $734,377 |
| 2019 | $8,786 | $799,874 | $78,521 | $721,353 |
| 2018 | $8,580 | $783,289 | $76,982 | $706,307 |
| 2017 | $8,446 | $768,157 | $75,473 | $692,684 |
| 2016 | $8,276 | $753,322 | $73,994 | $679,328 |
| 2015 | $7,870 | $742,182 | $72,884 | $669,298 |
| 2014 | $7,870 | $729,021 | $71,457 | $657,564 |
Source: Public Records
Map
Nearby Homes
- 1101 Johnson Blvd
- 3339 Cape Horn Rd
- 3342 Treehaven Dr
- 3338 Treehaven Dr
- 3334 Treehaven Dr
- 3520 Cloverdale Ave
- 1115 Glenwood Way
- 1201 Glenwood Way
- 1022 Fairway Ave
- 1151 Herbert Ave Unit B
- 3275 Marlette Cir
- 920 Balbijou Rd Unit 229
- 1304 Susie Lake Rd
- 1048 Trout Creek Ave
- 1291 Peninsula Rd
- 3546 Spruce Ave
- 3510 Rancho Cir
- 1309 Peninsula Rd
- 3608 Aspen Ave
- 1351 Gilmore Lake Rd
- 1135 Johnson Blvd
- 1139 Johnson Blvd
- 1143 Johnson Blvd
- 3404 Freel St
- 3400 Freel St
- 1126 Johnson Blvd
- 1098 Johnson Blvd
- 1140 Johnson Blvd
- 1091 Johnson Blvd
- 1157 Johnson Blvd
- 3464 Fairway Ave
- 3388 Freel St
- 1094 Bijou St
- 1152 Johnson Blvd
- 1161 Johnson Blvd
- 1117 Oak Ave
- 1109 Oak Ave
- 1103 Oak Ave
- 1121 Oak Ave
- 1084 Johnson Blvd