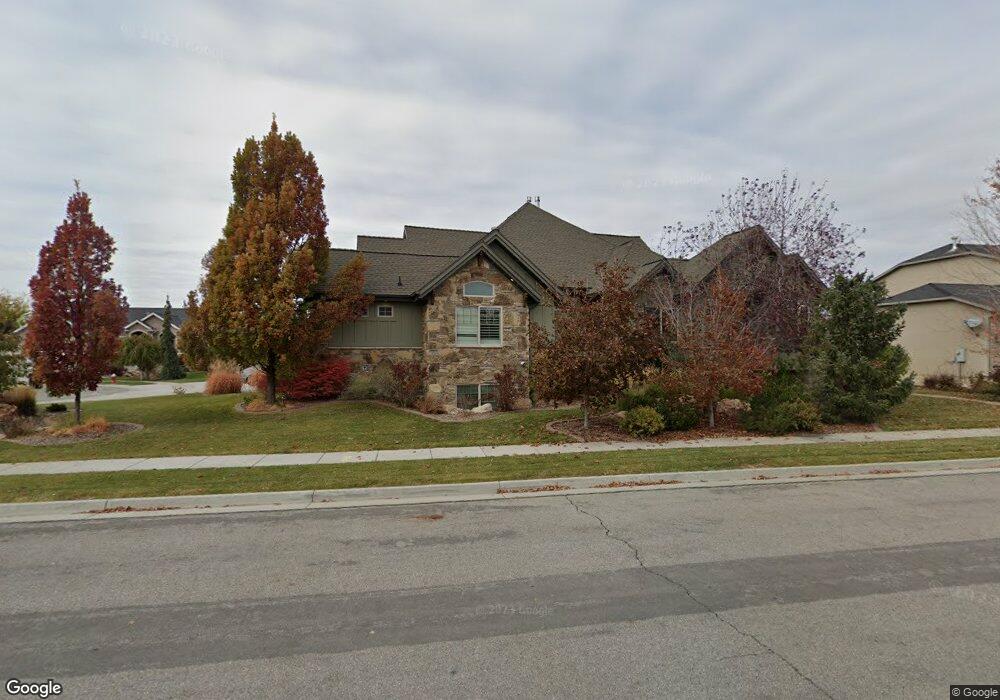
1126 W 2615 S Syracuse, UT 84075
Estimated Value: $584,000 - $688,266
5
Beds
4
Baths
3,528
Sq Ft
$183/Sq Ft
Est. Value
About This Home
This home is located at 1126 W 2615 S, Syracuse, UT 84075 and is currently estimated at $644,567, approximately $182 per square foot. 1126 W 2615 S is a home located in Davis County with nearby schools including Bluff Ridge Elementary, Legacy Junior High School, and Clearfield High School.
Ownership History
Date
Name
Owned For
Owner Type
Purchase Details
Closed on
Oct 18, 2017
Sold by
Poll Monte and Poll Heather
Bought by
Sanchez Jose Julian and Sanchez Trisha Lee
Current Estimated Value
Purchase Details
Closed on
Feb 3, 2016
Sold by
Poll Monte V and Poll Heather D
Bought by
Poll Monte V and Poll Heather D
Purchase Details
Closed on
Apr 13, 2001
Sold by
Charles Christiansen Construction Llc
Bought by
Poll Monte and Poll Heather D
Home Financials for this Owner
Home Financials are based on the most recent Mortgage that was taken out on this home.
Original Mortgage
$194,508
Interest Rate
7.09%
Purchase Details
Closed on
Oct 20, 2000
Sold by
Brocious David Emerson
Bought by
Charles Christiansen Construction Llc
Create a Home Valuation Report for This Property
The Home Valuation Report is an in-depth analysis detailing your home's value as well as a comparison with similar homes in the area
Home Values in the Area
Average Home Value in this Area
Purchase History
| Date | Buyer | Sale Price | Title Company |
|---|---|---|---|
| Sanchez Jose Julian | -- | -- | |
| Poll Monte V | -- | -- | |
| Poll Monte | -- | Northern Title & Escrow | |
| Charles Christiansen Construction Llc | -- | Northern Title & Escrow |
Source: Public Records
Mortgage History
| Date | Status | Borrower | Loan Amount |
|---|---|---|---|
| Previous Owner | Poll Monte | $194,508 |
Source: Public Records
Tax History Compared to Growth
Tax History
| Year | Tax Paid | Tax Assessment Tax Assessment Total Assessment is a certain percentage of the fair market value that is determined by local assessors to be the total taxable value of land and additions on the property. | Land | Improvement |
|---|---|---|---|---|
| 2025 | $3,500 | $337,700 | $133,538 | $204,162 |
| 2024 | $3,341 | $324,500 | $119,198 | $205,302 |
| 2023 | $3,215 | $569,000 | $165,569 | $403,431 |
| 2022 | $3,452 | $334,950 | $94,071 | $240,879 |
| 2021 | $3,029 | $455,000 | $140,037 | $314,963 |
| 2020 | $2,744 | $399,000 | $117,546 | $281,454 |
| 2019 | $2,626 | $377,000 | $120,351 | $256,649 |
| 2018 | $2,505 | $357,000 | $113,272 | $243,728 |
| 2016 | $2,099 | $156,860 | $43,277 | $113,583 |
| 2015 | $2,130 | $151,580 | $43,277 | $108,303 |
| 2014 | $2,177 | $157,902 | $43,277 | $114,625 |
| 2013 | -- | $145,449 | $38,165 | $107,284 |
Source: Public Records
Map
Nearby Homes
- 1146 W 2615 S
- 1108 W 2615 S
- 1119 W 2500 S
- 1166 W 2615 S
- 1155 W 2500 S
- 2627 S 1175 W
- 2627 S 1175 W Unit 11
- 1127 W 2615 S
- 1127 W 2615 S Unit 12
- 1101 W 2500 S
- 1089 W 2615 S
- 1177 W 2500 S
- 1107 W 2615 S
- 1107 W 2615 S Unit 13
- 1064 W 2600 S
- 2647 S 1175 W
- 2491 S 1150 W
- 1079 W 2500 S
- 2480 S 1100 W
- 1059 W 2600 S