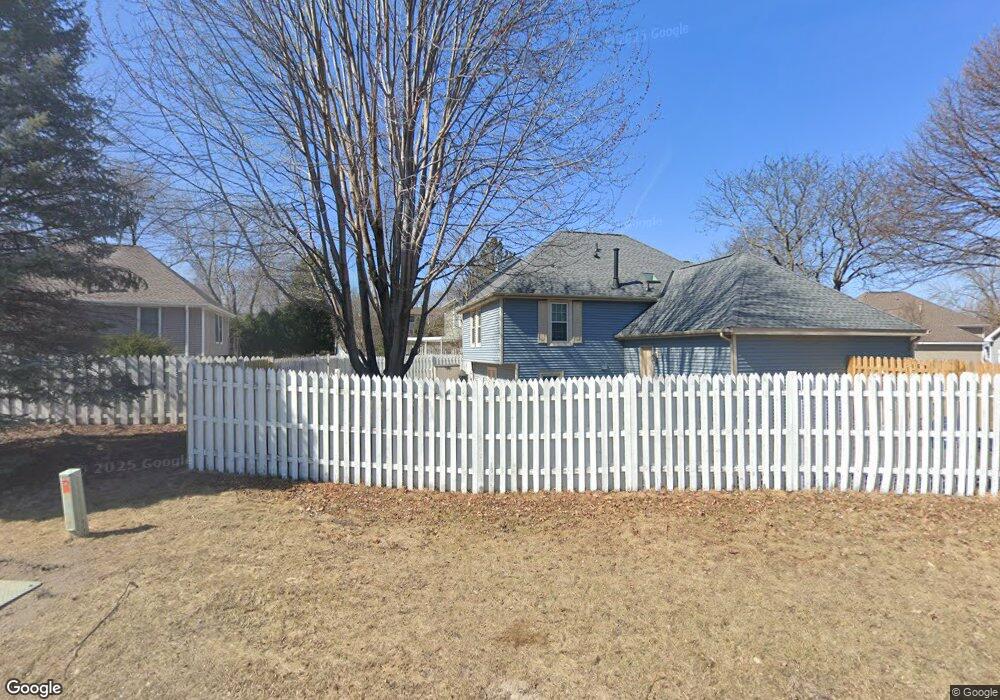
11275 49th Ave N Plymouth, MN 55442
Estimated Value: $407,684 - $429,000
3
Beds
3
Baths
1,420
Sq Ft
$296/Sq Ft
Est. Value
About This Home
This home is located at 11275 49th Ave N, Plymouth, MN 55442 and is currently estimated at $419,671, approximately $295 per square foot. 11275 49th Ave N is a home located in Hennepin County with nearby schools including Zachary Lane Elementary School, Plymouth Middle School, and Armstrong High School.
Ownership History
Date
Name
Owned For
Owner Type
Purchase Details
Closed on
Sep 19, 2019
Sold by
Wiley Latoya C
Bought by
Olayemi Bukola T and Awonaiya Olayemi
Current Estimated Value
Home Financials for this Owner
Home Financials are based on the most recent Mortgage that was taken out on this home.
Original Mortgage
$270,019
Outstanding Balance
$237,809
Interest Rate
3.87%
Mortgage Type
FHA
Estimated Equity
$181,862
Purchase Details
Closed on
Mar 15, 2016
Sold by
Gordon Kathleen M
Bought by
Wiley Latoya C
Home Financials for this Owner
Home Financials are based on the most recent Mortgage that was taken out on this home.
Original Mortgage
$220,899
Interest Rate
3.5%
Mortgage Type
FHA
Purchase Details
Closed on
Oct 22, 2002
Sold by
Pederson Cindy
Bought by
Gordon Kathleen M
Purchase Details
Closed on
Jul 31, 1998
Sold by
Scott Liam M and Scott Catherine O
Bought by
Pederson Cynthia L
Create a Home Valuation Report for This Property
The Home Valuation Report is an in-depth analysis detailing your home's value as well as a comparison with similar homes in the area
Home Values in the Area
Average Home Value in this Area
Purchase History
| Date | Buyer | Sale Price | Title Company |
|---|---|---|---|
| Olayemi Bukola T | $275,000 | Arden Title Llc | |
| Wiley Latoya C | $225,000 | Titlesmart Inc | |
| Gordon Kathleen M | $204,000 | -- | |
| Pederson Cynthia L | $155,000 | -- |
Source: Public Records
Mortgage History
| Date | Status | Borrower | Loan Amount |
|---|---|---|---|
| Open | Olayemi Bukola T | $270,019 | |
| Previous Owner | Wiley Latoya C | $220,899 |
Source: Public Records
Tax History Compared to Growth
Tax History
| Year | Tax Paid | Tax Assessment Tax Assessment Total Assessment is a certain percentage of the fair market value that is determined by local assessors to be the total taxable value of land and additions on the property. | Land | Improvement |
|---|---|---|---|---|
| 2024 | $4,146 | $364,400 | $110,000 | $254,400 |
| 2023 | $4,134 | $369,400 | $110,000 | $259,400 |
| 2022 | $3,484 | $353,000 | $105,000 | $248,000 |
| 2021 | $3,503 | $293,000 | $95,000 | $198,000 |
| 2020 | $3,783 | $293,000 | $100,000 | $193,000 |
| 2019 | $3,434 | $281,000 | $95,000 | $186,000 |
| 2018 | $3,042 | $267,000 | $83,000 | $184,000 |
| 2017 | $3,100 | $238,000 | $70,000 | $168,000 |
| 2016 | $3,217 | $234,000 | $69,000 | $165,000 |
| 2015 | $3,149 | $227,400 | $67,300 | $160,100 |
| 2014 | -- | $212,600 | $66,700 | $145,900 |
Source: Public Records
Map
Nearby Homes
- 4855 Cottonwood Ln N
- 4885 Deerwood Ln N
- 4835 Yorktown Ln N
- 11282 50th Place N
- 4645 Balsam Ln N
- 4755 Yorktown Ln N
- 11725 48th Place N
- 4720 Goldenrod Ln N
- 5105 Balsam Ln N
- 11100 52nd Ave N
- 4950 Valley Forge Ln N
- 11730 51st Ave N
- 11930 50th Ave N
- 12236 48th Place N
- 5304 Yorktown Ln N
- 5313 Yorktown Ln N
- 10695 53rd Ave N
- 4465 Trenton Ln N Unit 109
- 10630 Rockford Rd Unit 112
- 10630 Rockford Rd Unit 205
- 11271 49th Ave N
- 11279 49th Ave N
- 11263 49th Ave N
- 11287 49th Ave N
- 11283 49th Ave N
- 11291 49th Ave N
- 4890 Cottonwood Ln N
- 4880 Cottonwood Ln N
- 11259 49th Ave N
- 11266 49th Ave N
- 11278 49th Ave N
- 11295 49th Ave N
- 11282 49th Ave N
- 11299 49th Ave N
- 11255 49th Ave N
- 11251 49th Ave N
- 11262 49th Ave N
- 11270 49th Ave N
- 4860 Cottonwood Ln N
- 11274 49th Ave N