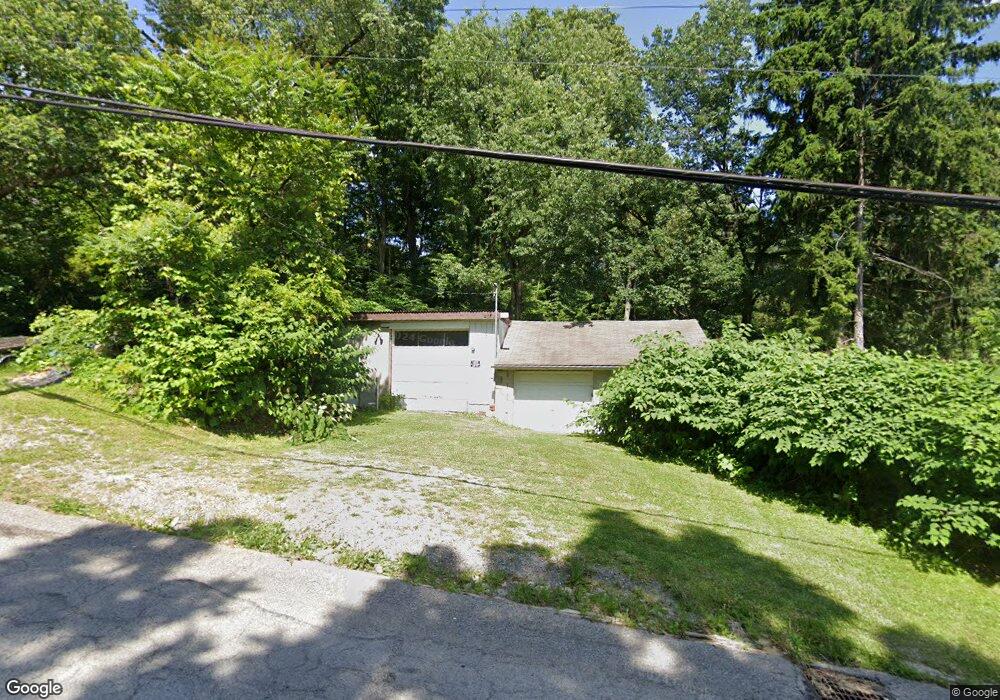
1128 19th Ave Beaver Falls, PA 15010
Patterson Township NeighborhoodEstimated Value: $183,000 - $208,000
3
Beds
1
Bath
1,010
Sq Ft
$197/Sq Ft
Est. Value
About This Home
This home is located at 1128 19th Ave, Beaver Falls, PA 15010 and is currently estimated at $199,384, approximately $197 per square foot. 1128 19th Ave is a home located in Beaver County with nearby schools including Blackhawk High School and Saint Monica Catholic Academy.
Ownership History
Date
Name
Owned For
Owner Type
Purchase Details
Closed on
May 19, 2016
Sold by
Jones John F and Brien Jones Tina M O
Bought by
Hill Chad A and Hill Kimberly
Current Estimated Value
Home Financials for this Owner
Home Financials are based on the most recent Mortgage that was taken out on this home.
Original Mortgage
$44,822
Outstanding Balance
$35,600
Interest Rate
3.59%
Mortgage Type
VA
Estimated Equity
$163,784
Purchase Details
Closed on
Jun 3, 2004
Sold by
Mcelroy Ronnie L
Bought by
Jones John F
Create a Home Valuation Report for This Property
The Home Valuation Report is an in-depth analysis detailing your home's value as well as a comparison with similar homes in the area
Home Values in the Area
Average Home Value in this Area
Purchase History
| Date | Buyer | Sale Price | Title Company |
|---|---|---|---|
| Hill Chad A | $43,879 | None Available | |
| Jones John F | $65,000 | -- |
Source: Public Records
Mortgage History
| Date | Status | Borrower | Loan Amount |
|---|---|---|---|
| Open | Hill Chad A | $44,822 |
Source: Public Records
Tax History Compared to Growth
Tax History
| Year | Tax Paid | Tax Assessment Tax Assessment Total Assessment is a certain percentage of the fair market value that is determined by local assessors to be the total taxable value of land and additions on the property. | Land | Improvement |
|---|---|---|---|---|
| 2025 | $661 | $90,050 | $18,600 | $71,450 |
| 2024 | $2,958 | $90,050 | $18,600 | $71,450 |
| 2023 | $2,911 | $25,700 | $3,400 | $22,300 |
| 2022 | $2,885 | $25,700 | $3,400 | $22,300 |
| 2021 | $2,885 | $25,700 | $3,400 | $22,300 |
| 2020 | $2,833 | $25,700 | $3,400 | $22,300 |
| 2019 | $2,833 | $25,700 | $3,400 | $22,300 |
| 2018 | $2,782 | $25,700 | $3,400 | $22,300 |
| 2017 | $2,782 | $25,700 | $3,400 | $22,300 |
| 2016 | $2,508 | $25,700 | $3,400 | $22,300 |
| 2015 | $571 | $25,700 | $3,400 | $22,300 |
| 2014 | $571 | $25,700 | $3,400 | $22,300 |
Source: Public Records
Map
Nearby Homes